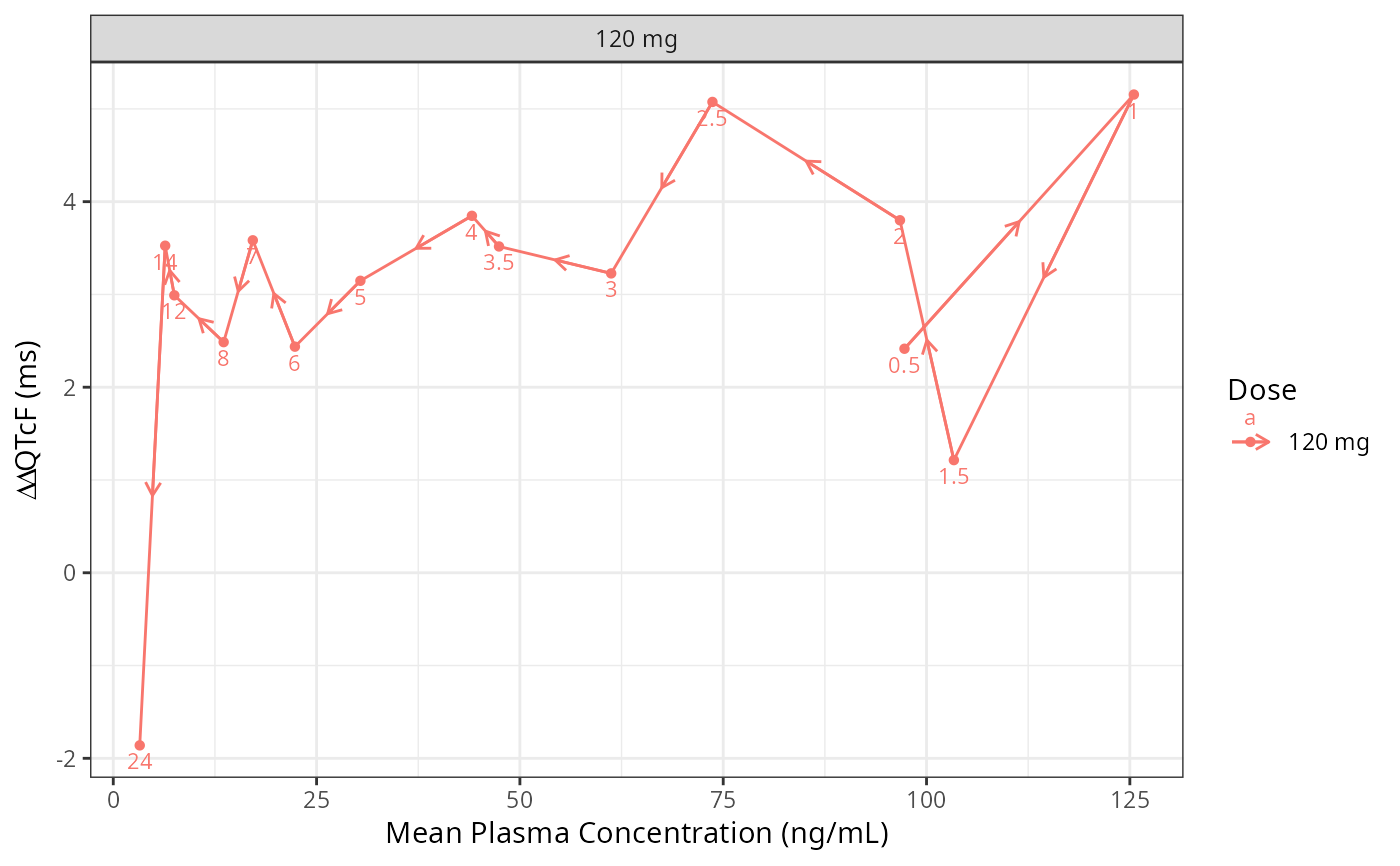
EDA Hysteresis Loop Plot
eda_hysteresis_loop_plot.RdHysteresis loop plot to visually inspect hysteresis. Counter-clockwise loops (effect lags concentration) suggest hysteresis may be present.
Usage
eda_hysteresis_loop_plot(
  data,
  ntime_col,
  deltaqtc_col,
  conc_col,
  dosef_col,
  group_col = NULL,
  reference_dose = NULL,
  show_hysteresis_warning = TRUE,
  style = list()
)
Arguments
- data
A data frame containing C-QT analysis dataset
- ntime_col
An unquoted column name for nominal time points
- deltaqtc_col
An unquoted column name for dQTC measurements at the time points in NTLD
- conc_col
An unquoted column name for drug concentrations at each NTLD
- dosef_col
An unquoted column name for DOSE factors.
- group_col
An unquoted column name for additional grouping column
- reference_dose
Reference dose value for comparison calculations
- show_hysteresis_warning
Logical, whether to add "Hysteresis Detected" to facet labels for affected groups
- style
A named list of arguments passed to style_plot()
Value
A faceted plot showing concentration vs deltaQTc trajectories over time with directional arrows
Details
When show_hysteresis_warning = TRUE, facet labels are annotated based on
the detection algorithm in compute_potential_hysteresis(), which flags
hysteresis when the time of max effect (Umax) lags max concentration (Tmax)
by >= 1 hour and more than 3 timepoints show mean deltaQTc > 5 ms.
See also
compute_potential_hysteresis() for the detection algorithm used when
show_hysteresis_warning = TRUE
Examples
data_proc <- preprocess(cqtkit_data_verapamil)

eda_hysteresis_loop_plot(
  data_proc,
  NTLD,
  deltaQTCF,
  CONC,
  DOSEF,
  reference_dose = "0 mg",
  style = set_style(
    ylabel = bquote(Delta~Delta~"QTcF (ms)")
  )
)