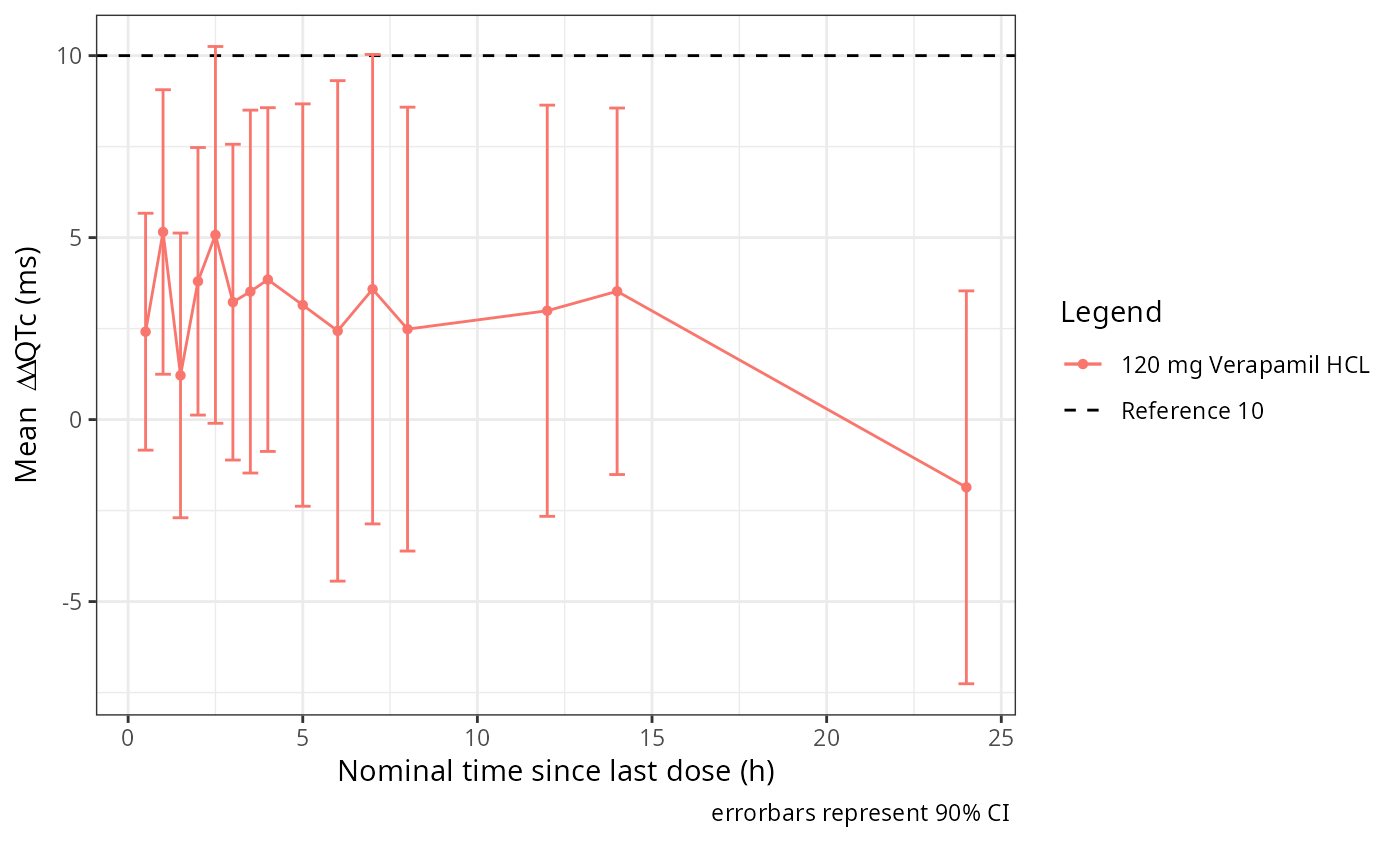
EDA Mean DV Over Time
eda_mean_dv_over_time.RdPlots mean dependent variable over time.
Usage
eda_mean_dv_over_time(
  data,
  dv_col,
  ntime_col,
  dosef_col,
  secondary_data_col = NULL,
  group_col = NULL,
  reference_dose = NULL,
  reference_threshold = NULL,
  conf_int = 0.9,
  scale_factor = NULL,
  shift_factor = NULL,
  error_bars = "CI",
  sec_ylabel = "Concentration (ng/mL)",
  style = list()
)
Arguments
- data
A data frame containing C-QT analysis dataset
- dv_col
An unquoted column name for dependent variable
- ntime_col
An unquoted column name for nominal Time grouping
- dosef_col
An unquoted column name for Dose grouping
- secondary_data_col
Optional unquoted column name to overlay on secondary y-axis
- group_col
An unquoted column name for additional grouping column
- reference_dose
Reference dose value for comparison calculations
- reference_threshold
Optional - a numeric or vector of numerics to add dashed lines to plot
- conf_int
Numeric confidence interval level (default: 0.9)
- scale_factor
Optional scale factor for scaling secondary_data_col
- shift_factor
Optional additive factor for shifting secondary data
- error_bars
A string for setting which errorbars are shown, CI, SE, SD
- sec_ylabel
A string for secondary ylabel, default is Concentration (ng/mL)
- style
A named list of arguments passed to style_plot(). Shapes are mapped to grouping variables and can be controlled via the shapes parameter in style
Value
A line plot of mean dependent variable over time with optional error bars, reference lines, and secondary axis
Examples
data_proc <- preprocess(cqtkit_data_verapamil)

eda_mean_dv_over_time(
  data_proc,
  deltaQTCF,
  NTLD,
  DOSEF,
  group_col = TRTG,
  reference_dose = "0 mg",
  reference_threshold = 10,
  style = set_style(ylabel = bquote('Mean '~Delta~Delta~'QTc (ms)')))