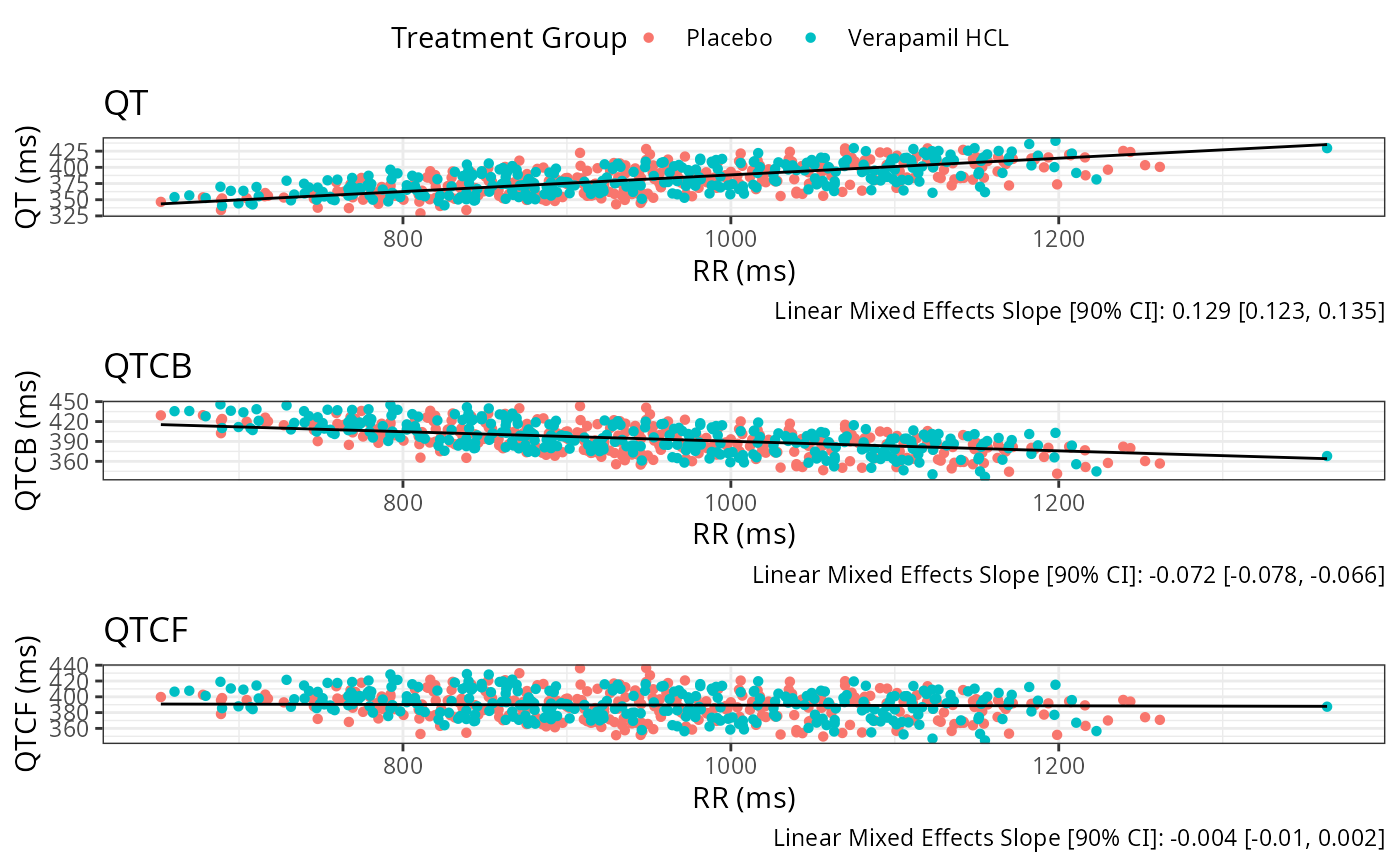
EDA QTc Comparison Plot
eda_qtc_comparison_plot.RdPlots different corrections of QT against RR to compare which to use.
Arguments
- data
A data frame containing C-QT analysis dataset
- rr_col
An unquoted column name for RR measurements
- qt_col
An unquoted column name for QT measurements
- qtcb_col
An unquoted column name for Bazett corrected QT data
- qtcf_col
An unquoted column name for Fridericia corrected QT data
- qtcp_col
An unquoted column name for QTc measurements
- id_col
An unquoted column name for subject ID
- trt_col
An unquoted column name for treatment group data
- legend_location
String for legend position (top, bottom, left, right)
- model_type
Lm or lme, which model to fit for showing on plot
- show_model_results
Logical, whether to show regression slope on plot
- method
Method for nlme::lme fitting (ML or REML)
- remove_rr_iiv
Logical, whether to remove IIV on RR slope
- conf_int
Numeric confidence interval level (default: 0.9)
- style
A named list of arguments passed to style_plot()
Examples
data_proc <- preprocess(cqtkit_data_verapamil)

eda_qtc_comparison_plot(
  data_proc,
  RR,
  QT,
  QTCB,
  QTCF,
  id_col = ID,
  trt_col = TRTG,
  model_type = "lme",
  show_model_results = TRUE,
  remove_rr_iiv = TRUE,
  legend_location = 'top')