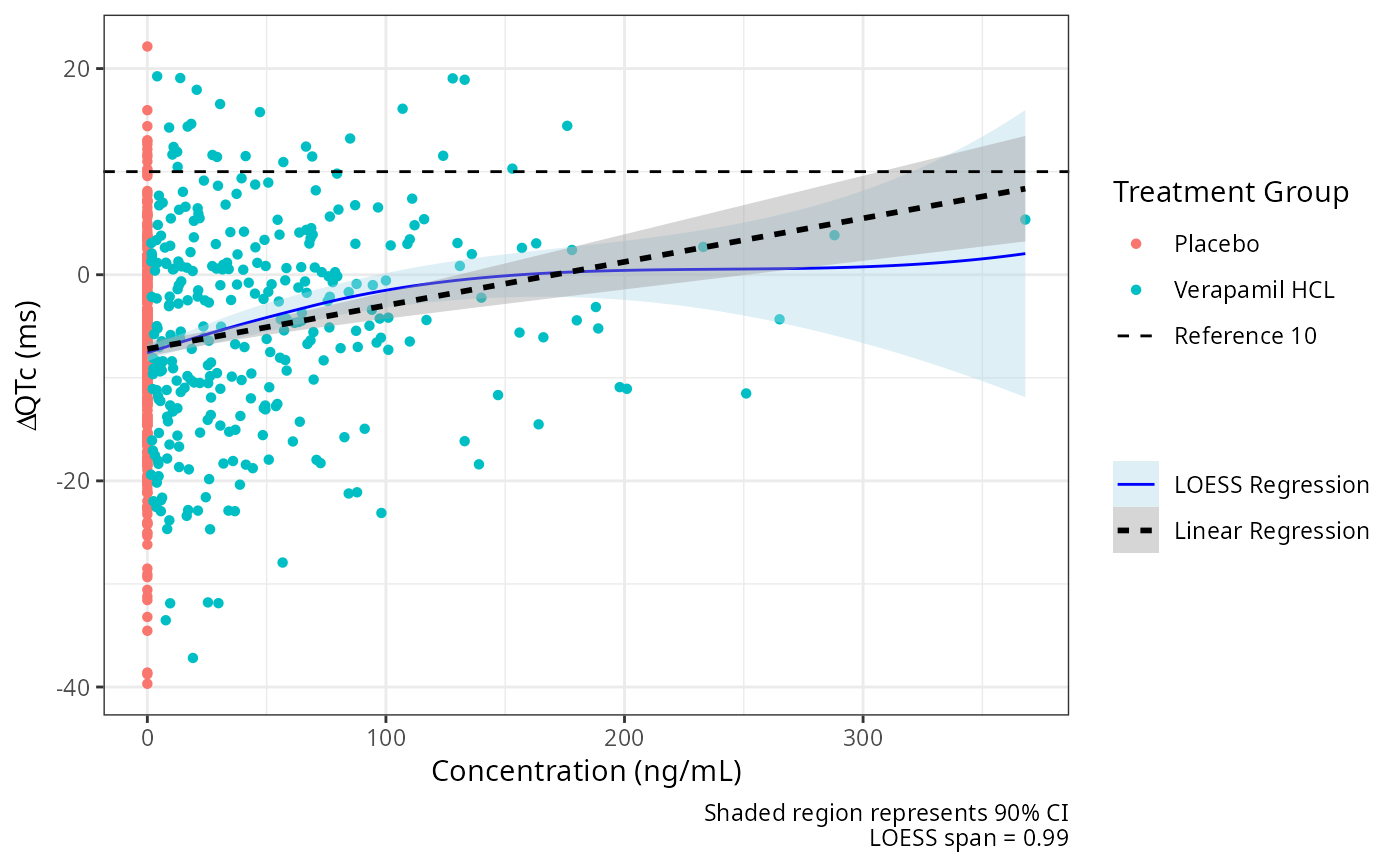
EDA Scatter With Regressions
eda_scatter_with_regressions.RdPlots scatter plot with linear and loess regressions. Can be used to check for linearity.
Usage
eda_scatter_with_regressions(
  data,
  ydata_col,
  xdata_col,
  trt_col = NULL,
  reference_threshold = NULL,
  loess_line = TRUE,
  linear_line = TRUE,
  span = 0.99,
  conf_int = 0.9,
  style = list()
)
Arguments
- data
A data frame containing C-QT analysis dataset
- ydata_col
An unquoted column name for dependent variable measurements
- xdata_col
An unquoted column name for independent variable measurements
- trt_col
An unquoted column name for treatment group
- reference_threshold
Optional vector of numbers to add as horizontal dashed lines
- loess_line
Logical, whether to add LOESS regression line
- linear_line
Logical, whether to add linear regression line
- span
A fractional value for LOESS span parameter in geom_smooth if LOESS is used, default 0.99
- conf_int
Numeric confidence interval level (default: 0.9)
- style
A named list of arguments passed to style_plot(). Shapes are mapped to treatment groups and can be controlled via the shapes parameter in style
Examples
data_proc <- preprocess(cqtkit_data_verapamil)

eda_scatter_with_regressions(
  data_proc,
  deltaQTCF,
  CONC,
  TRTG,
  reference_threshold = 10)