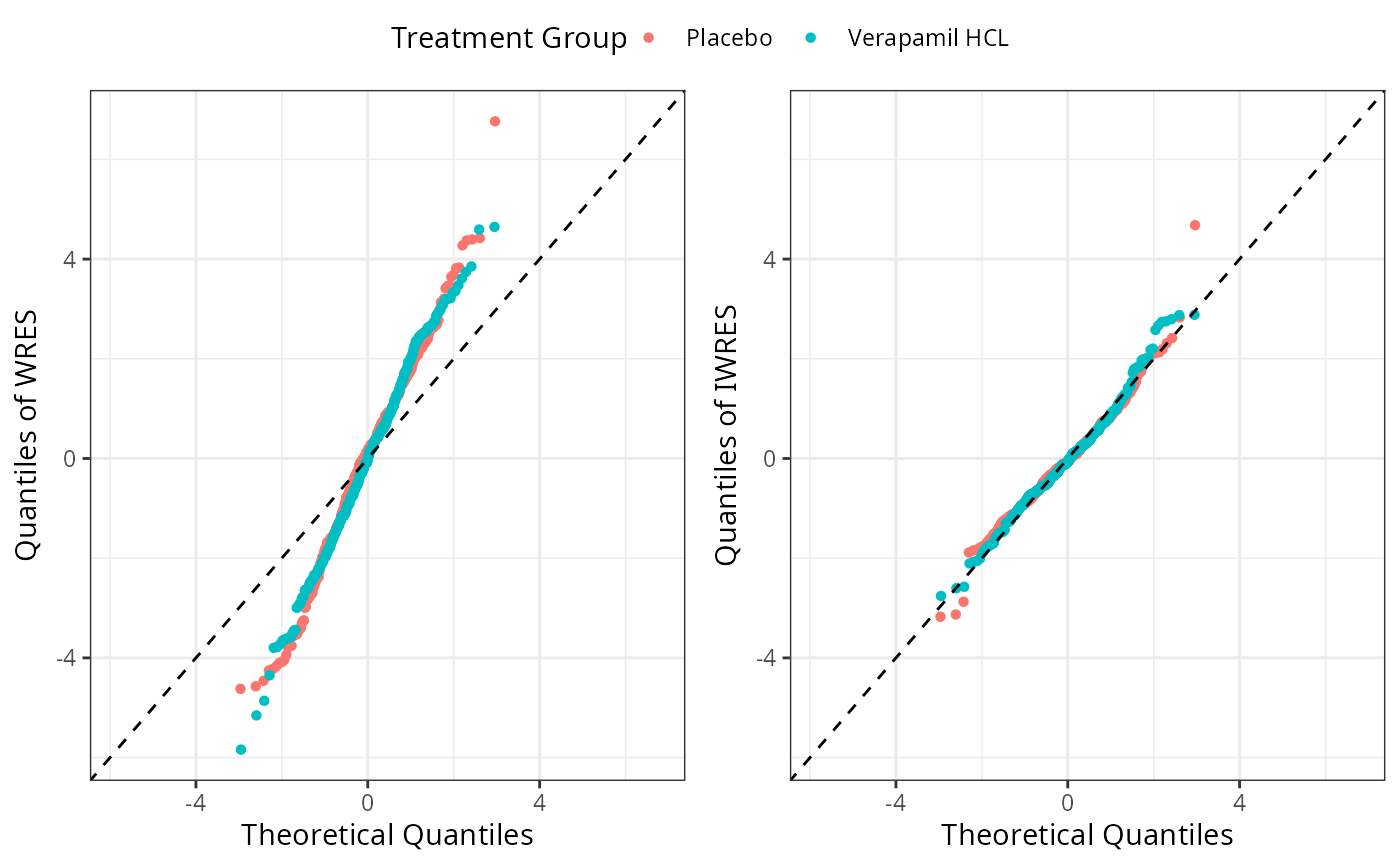
GOF QQ Plots
gof_qq_plots.RdPlots QQ plot of WRES and IWRES.
Arguments
- data
A data frame containing C-QT analysis dataset
- fit
An nlme::lme model object from model fitting
- dv_col
An unquoted column name for dependent variable measurements
- conc_col
An unquoted column name for drug concentration measurements
- ntime_col
An unquoted column name for nominal time since dose
- trt_col
An unquoted column name for treatment group"
- legend_location
String for legend position (top, bottom, left, right)
- style
A named list of arguments passed to style_plot()
Examples
data_proc <- preprocess(cqtkit_data_verapamil)
fit <- fit_prespecified_model(
  data_proc,
  deltaQTCF,
  ID,
  CONC,
  deltaQTCFBL,
  TRTG,
  TAFD,
  "REML",
  TRUE
)

gof_qq_plots(data_proc, fit, deltaQTCF, CONC, NTLD, TRTG, legend_location = "top")