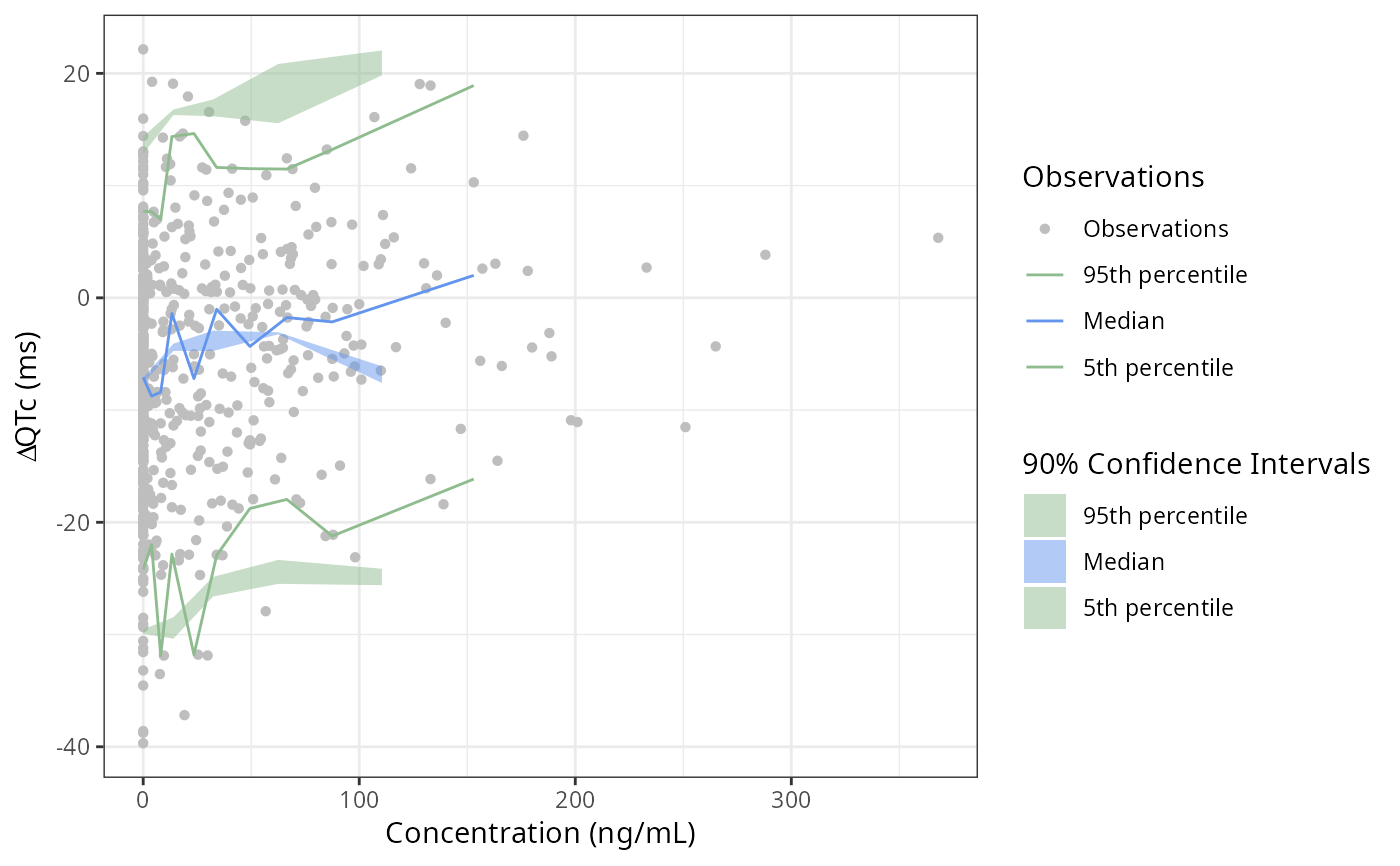
GOF VPC Plot
gof_vpc_plot.RdPerforms a visual predictive check and plots the results.
Usage
gof_vpc_plot(
  data,
  fit,
  xdata_col,
  dv_col,
  conf_int = 0.9,
  nruns = 500,
  nbins = 10,
  type = 2,
  style = list()
)
Arguments
- data
A data frame containing C-QT analysis dataset
- fit
An nlme::lme model object from model fitting
- xdata_col
An unquoted column name for independent variable
- dv_col
An unquoted column name for dependent variable
- conf_int
Numeric confidence interval level (default: 0.9)
- nruns
Integer number of simulations to run
- nbins
Integer number of bins to break independent variable into - OR - a user specified vector for non-uniform binning
- type
Integer for type parameter of stats::quantile
- style
A named list of arguments passed to style_plot()
Value
A visual predictive check plot with observed quantiles overlaid on simulated prediction intervals
Examples
data_proc <- preprocess(cqtkit_data_verapamil)
fit <- fit_prespecified_model(
  data_proc,
  deltaQTCF,
  ID,
  CONC,
  deltaQTCFBL,
  TRTG,
  TAFD,
  "REML",
  TRUE
)

gof_vpc_plot(data_proc, fit, CONC, deltaQTCF, nruns = 2)
#> Warning: Your xdata quantiles had duplicates. Filtering for x values > 0