Predict With Quantiles Plot
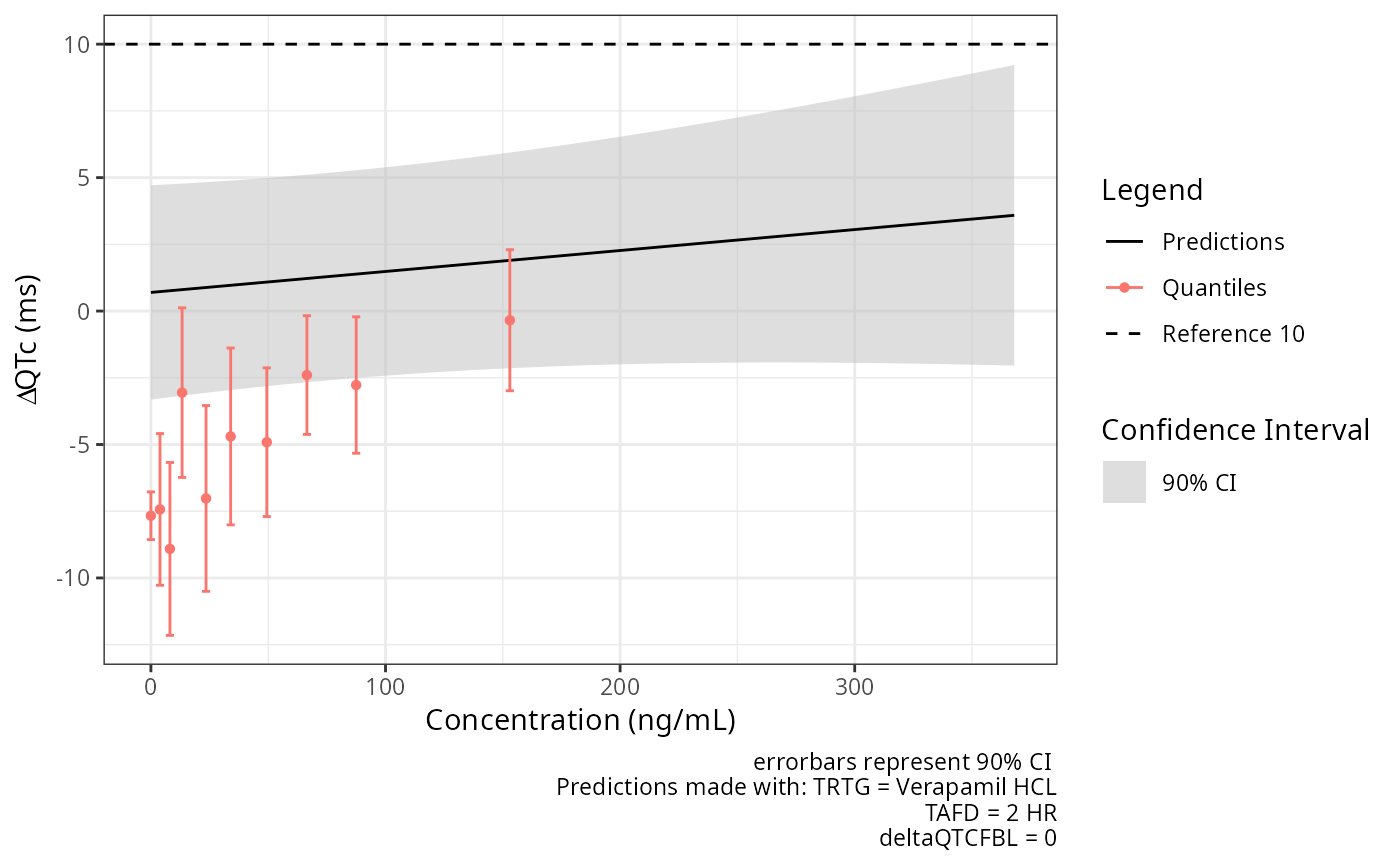
predict_with_quantiles_plot.RdPlots predictions and 90% CI.
Arguments
- data
A data frame containing C-QT analysis dataset
- fit
An nlme::lme model object from model fitting
- conc_col
An unquoted column name for concentration measurements
- dv_col
An unquoted column name for dependent variable measurements
- id_col
An unquoted column name for subject ID
- ntime_col
An unquoted column name for nominal time since dose
- trt_col
An unquoted column name for treatment group
- treatment_predictors
List of a values for contrast. CONC will update
- control_predictors
List of b values for contrast
- reference_threshold
Optional vector of numbers to add as horizontal dashed lines
- conf_int
Numeric confidence interval level (default: 0.9)
- nbins
Number of bins for quantiles, or vector of cut points for computing average
- error_bars
A string to denote which errorbars to show, CI, SE, SD or none.
- contrast_method
A string specifying contrast method when using control_predictors: "matched" for individual ID+time matching (crossover studies), "group" for group-wise subtraction (parallel studies)
- style
A named list of arguments passed to style_plot()
Examples
data_proc <- preprocess(cqtkit_data_verapamil)
fit <- fit_prespecified_model(
  data_proc,
  deltaQTCF,
  ID,
  CONC,
  deltaQTCFBL,
  TRTG,
  TAFD,
  "REML",
  TRUE
)
predict_with_quantiles_plot(
  data_proc,
  fit,
  CONC,
  deltaQTCF,
  treatment_predictors = list(
    CONC = 0,
    TRTG = "Verapamil HCL",
    TAFD = "2 HR",
    deltaQTCFBL = 0
  )
)
#> Warning: Your xdata quantiles had duplicates. Filtering for x values > 0