
Plot time series decomposition components using ggplot
Source:R/ggplot.R, R/mstl.R
autoplot.seas.RdProduces a ggplot object of seasonally decomposed time series for objects of
class “stl” (created with stl), class
“seas” (created with seas), or class
“decomposed.ts” (created with decompose).
Usage
# S3 method for class 'decomposed.ts'
autoplot(object, labels = NULL, range.bars = NULL, ...)

# S3 method for class 'stl'
autoplot(object, labels = NULL, range.bars = TRUE, ...)

# S3 method for class 'StructTS'
autoplot(object, labels = NULL, range.bars = TRUE, ...)

# S3 method for class 'seas'
autoplot(object, labels = NULL, range.bars = NULL, ...)

# S3 method for class 'mstl'
autoplot(object, ...)
Arguments
- object
Object of class “
seas”, “stl”, or “decomposed.ts”.- labels
Labels to replace “seasonal”, “trend”, and “remainder”.
- range.bars
Logical indicating if each plot should have a bar at its right side representing relative size. If
NULL, automatic selection takes place.- ...
Other plotting parameters to affect the plot.
Examples
library(ggplot2)
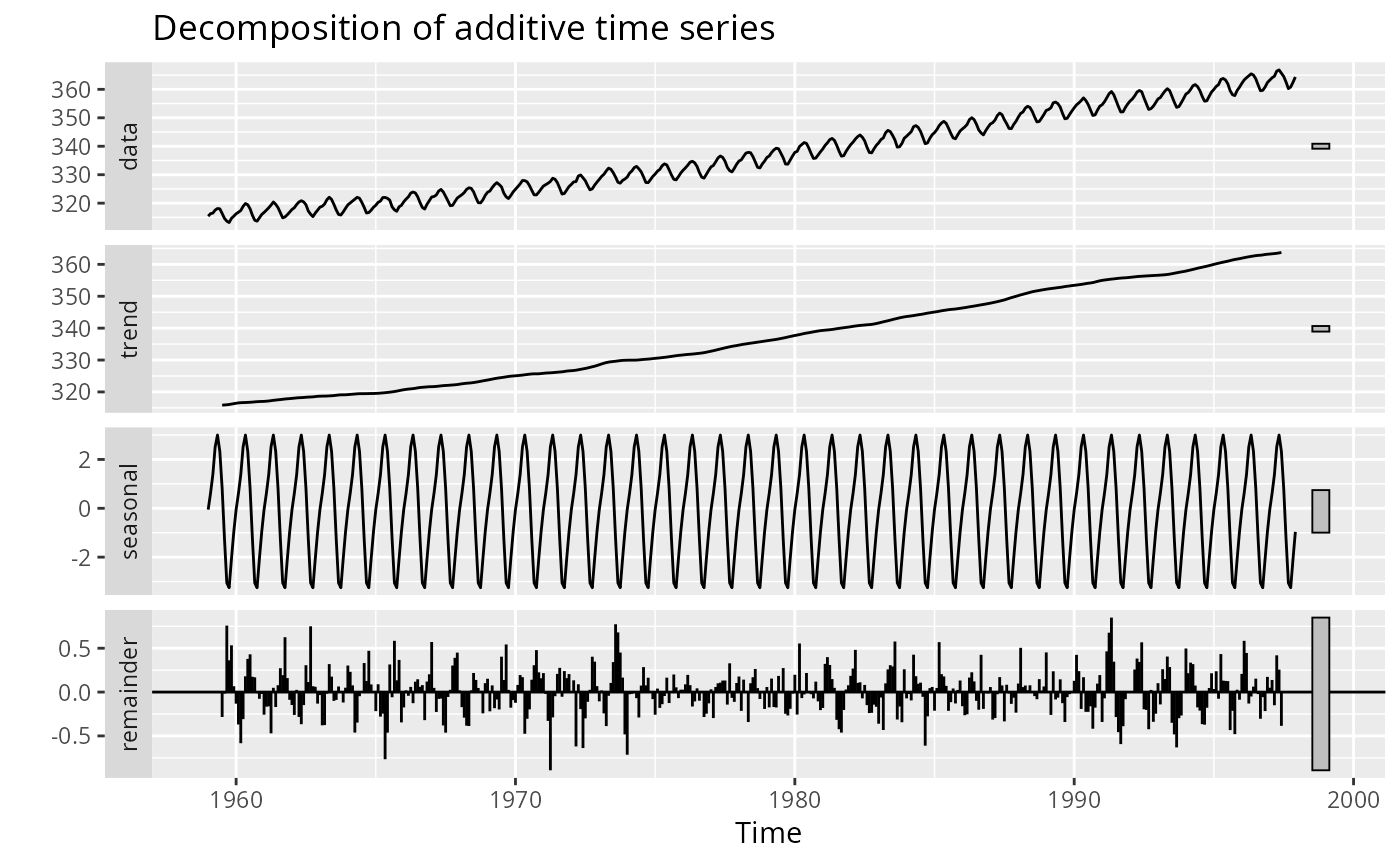
co2 %>%
decompose() %>%
autoplot()
#> Warning: Using `size` aesthetic for lines was deprecated in ggplot2 3.4.0.
#> ℹ Please use `linewidth` instead.
#> ℹ The deprecated feature was likely used in the forecast package.
#> Please report the issue at <https://github.com/robjhyndman/forecast/issues>.
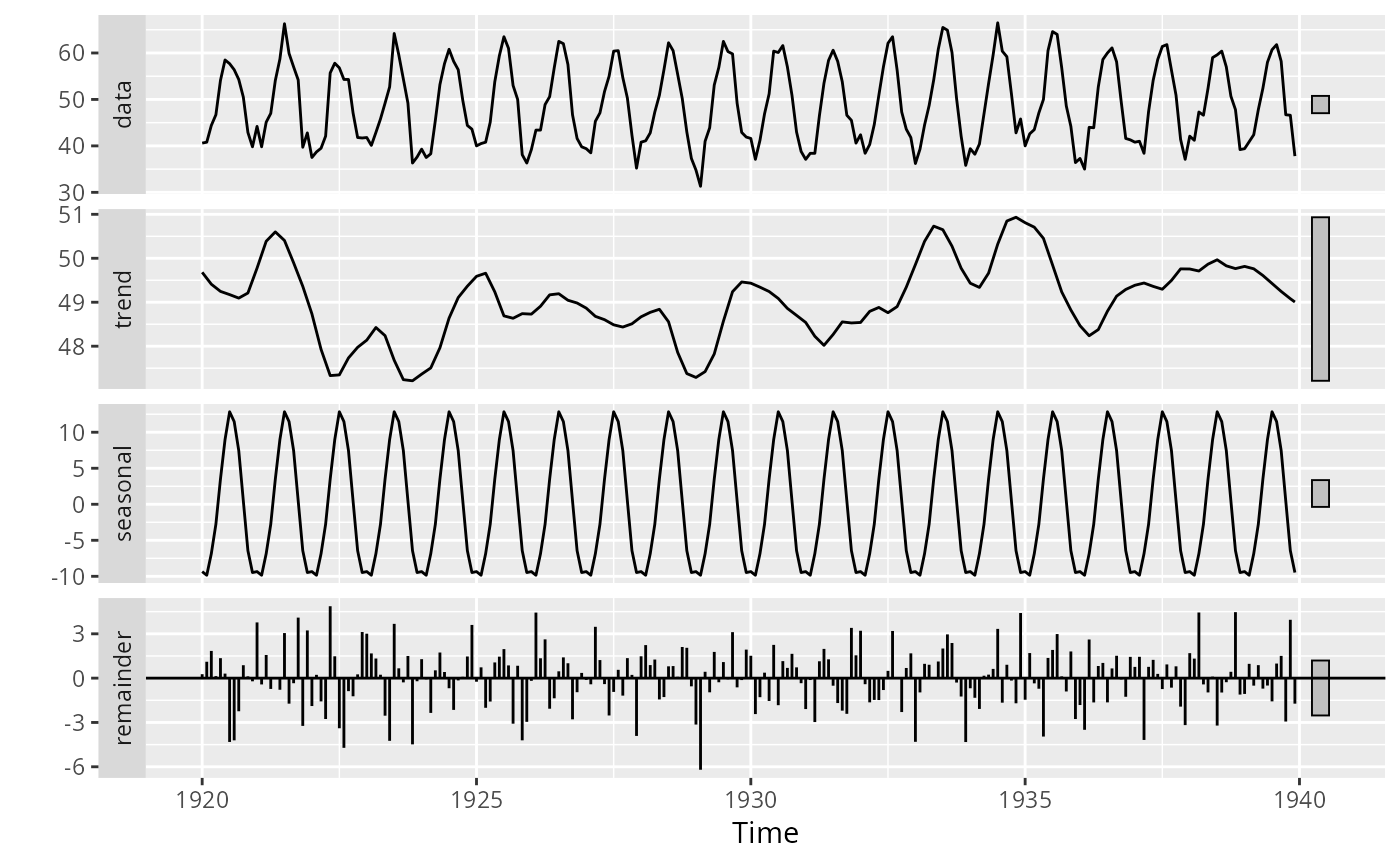
 nottem %>%
stl(s.window = "periodic") %>%
autoplot()
nottem %>%
stl(s.window = "periodic") %>%
autoplot()
 if (FALSE) { # \dontrun{
library(seasonal)
seas(USAccDeaths) %>% autoplot()
} # }
if (FALSE) { # \dontrun{
library(seasonal)
seas(USAccDeaths) %>% autoplot()
} # }