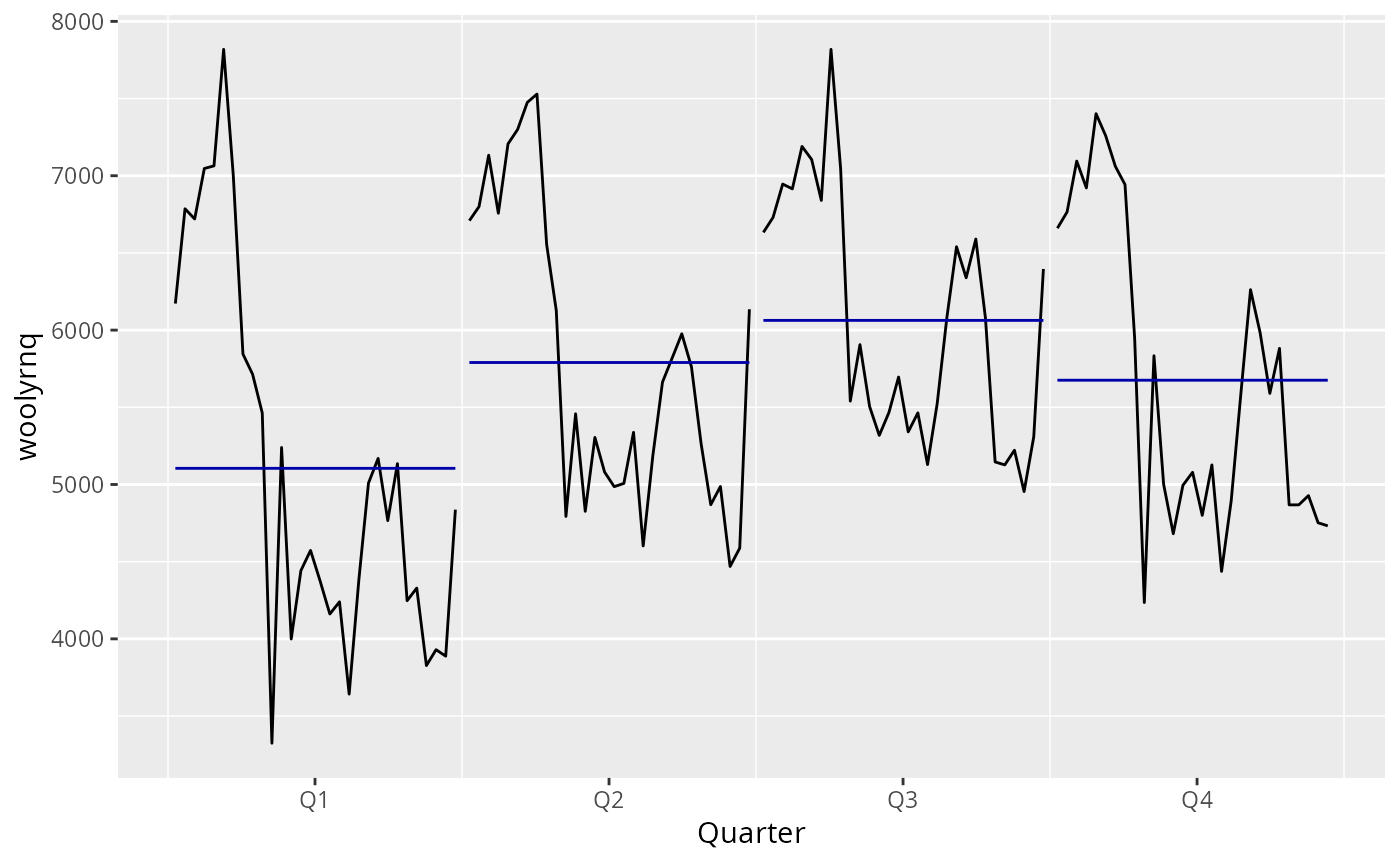
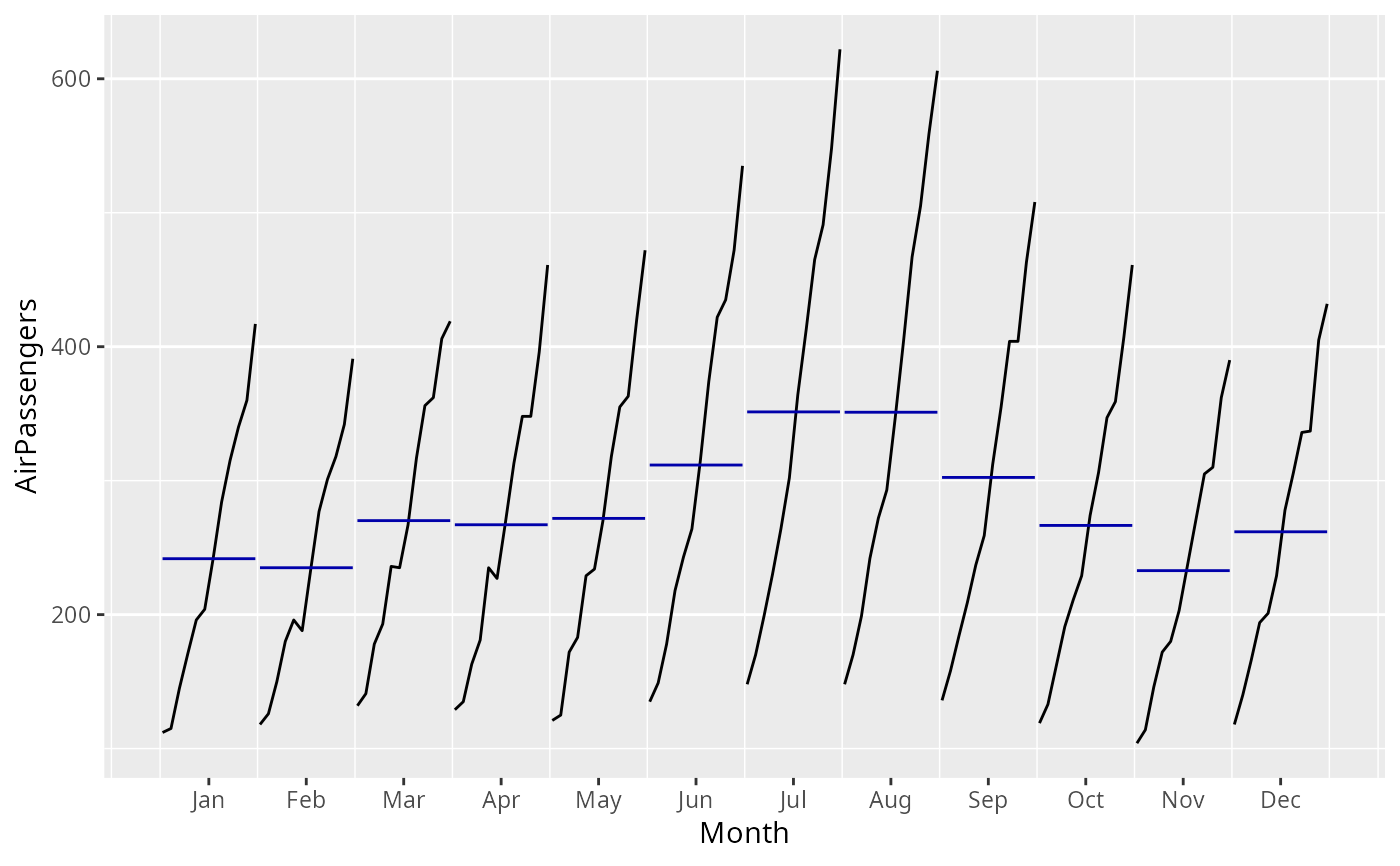
Plots a subseries plot using ggplot. Each season is plotted as a separate mini time series. The blue lines represent the mean of the observations within each season.
Details
The ggmonthplot function is simply a wrapper for
ggsubseriesplot as a convenience for users familiar with
monthplot.
Examples
ggsubseriesplot(AirPassengers)
#> Warning: Arguments in `...` must be used.
#> ✖ Problematic argument:
#> • na.rm = TRUE
#> ℹ Did you misspell an argument name?
 ggsubseriesplot(woolyrnq)
#> Warning: Arguments in `...` must be used.
#> ✖ Problematic argument:
#> • na.rm = TRUE
#> ℹ Did you misspell an argument name?
ggsubseriesplot(woolyrnq)
#> Warning: Arguments in `...` must be used.
#> ✖ Problematic argument:
#> • na.rm = TRUE
#> ℹ Did you misspell an argument name?