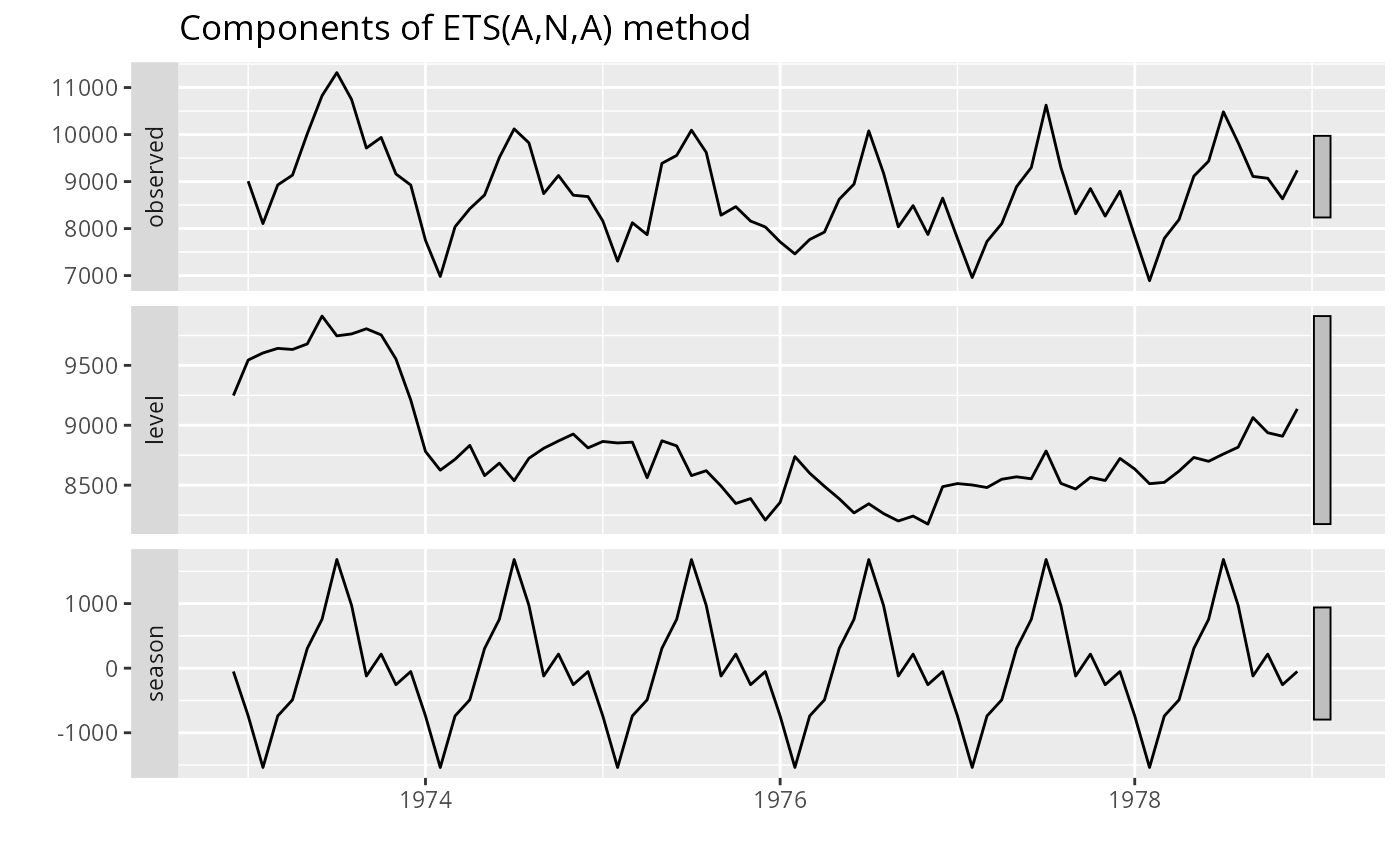
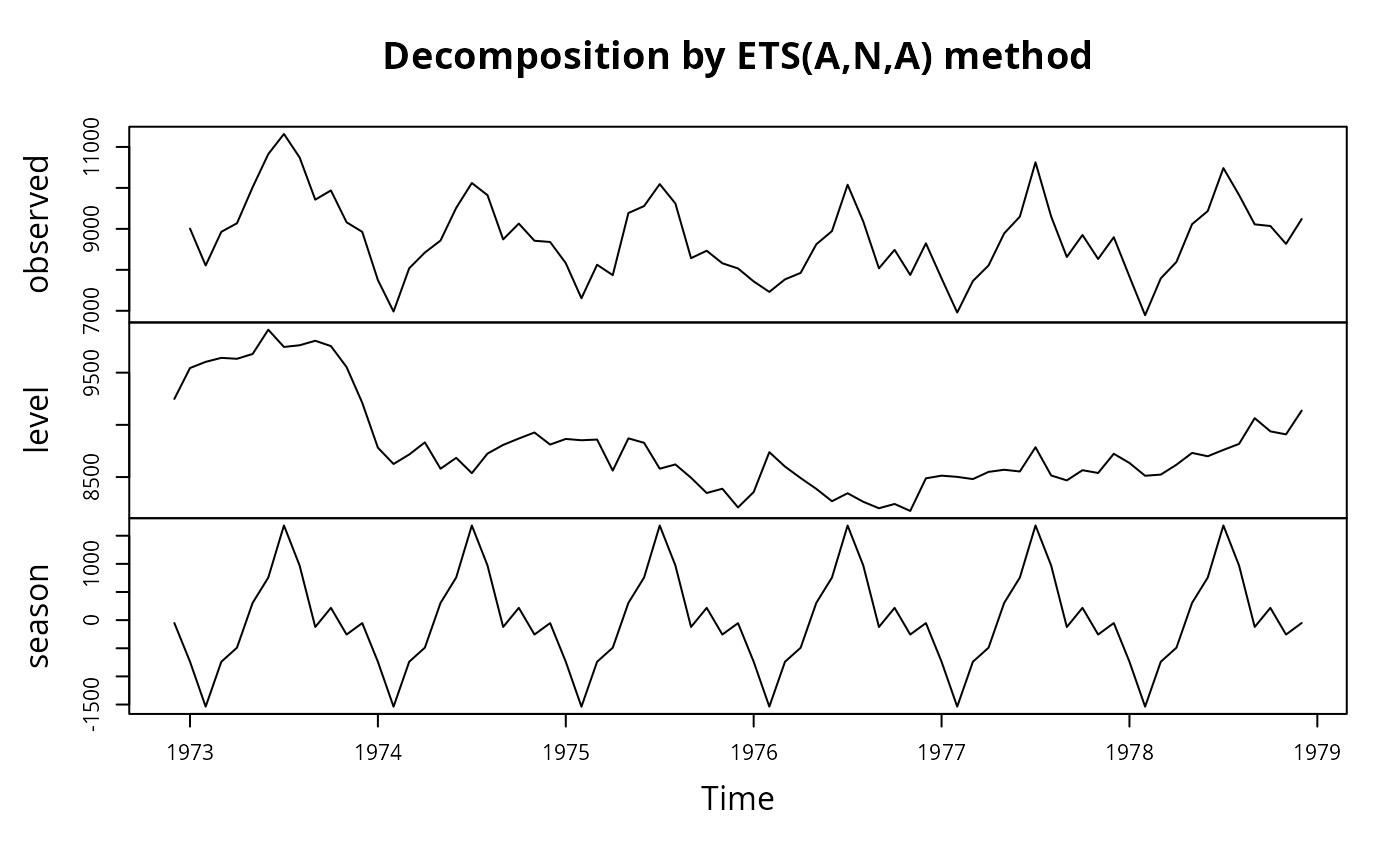
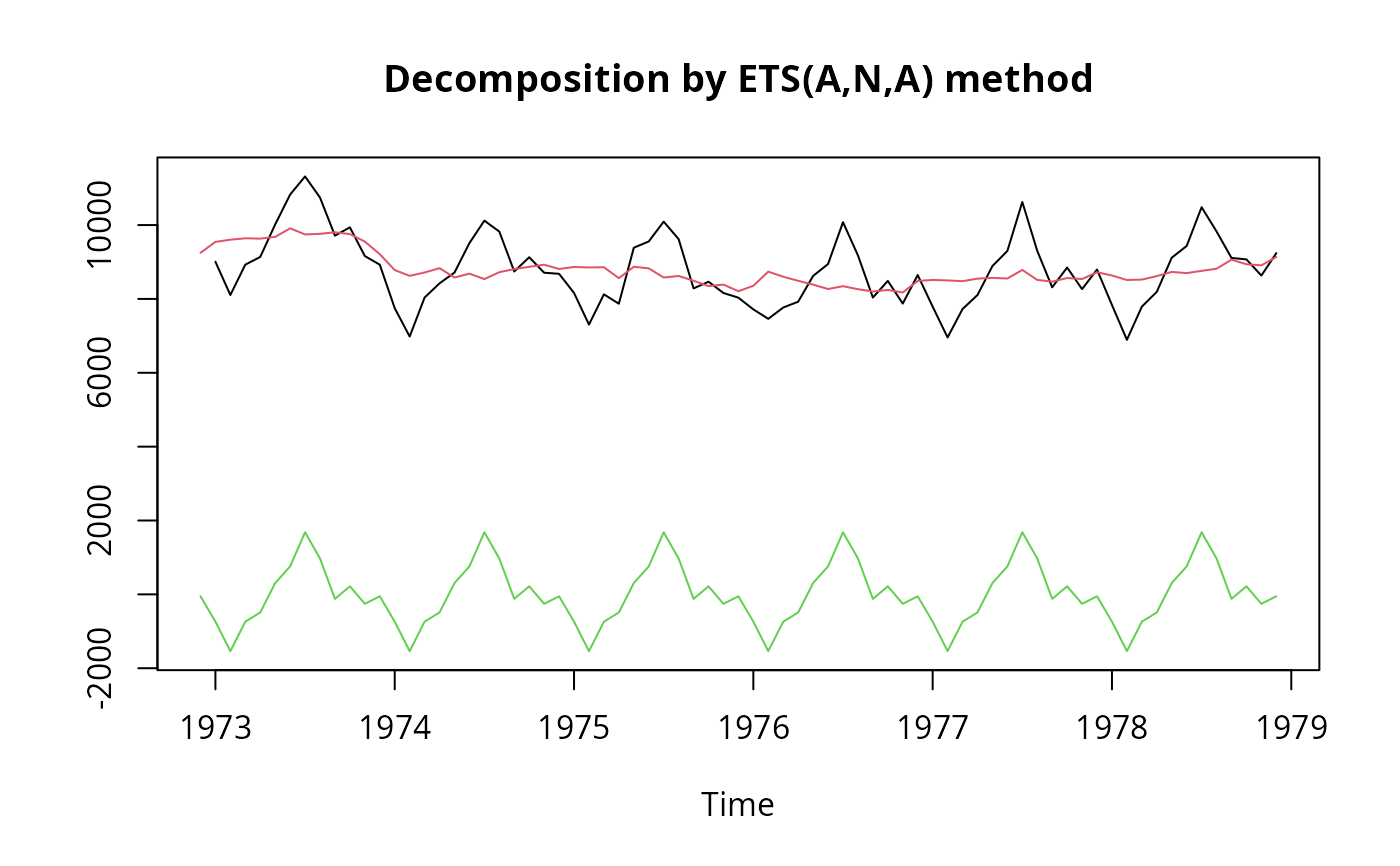
Produces a plot of the level, slope and seasonal components from an ETS
model.
Usage
# S3 method for class 'ets'
plot(x, ...)

# S3 method for class 'ets'
autoplot(object, range.bars = NULL, ...)
Arguments
- x
Object of class “ets”.
- ...
Other plotting parameters to affect the plot.
- object
Object of class “ets”. Used for ggplot graphics (S3
method consistency).
- range.bars
Logical indicating if each plot should have a bar at its
right side representing relative size. If NULL, automatic selection takes
place.
Value
None. Function produces a plot
Details
autoplot will produce an equivalent plot as a ggplot object.
Author
Rob J Hyndman & Mitchell O'Hara-Wild
Examples
fit <- ets(USAccDeaths)
plot(fit)
 plot(fit,plot.type="single",ylab="",col=1:3)
 library(ggplot2)
autoplot(fit)
#> Warning: Arguments in `...` must be used.
#> ✖ Problematic argument:
#> • ylab = ""
#> ℹ Did you misspell an argument name?
library(ggplot2)
autoplot(fit)
#> Warning: Arguments in `...` must be used.
#> ✖ Problematic argument:
#> • ylab = ""
#> ℹ Did you misspell an argument name?