Create a Hexgon Grid
hexGraphPaper.RdCreates a hexagon grid that can be added to a plot created with grid graphics.
Usage
hexGraphPaper(hb, xbnds = NULL, ybnds = NULL, xbins = 30, shape = 1,
              add = TRUE, fill.edges = 1, fill = 0, border = 1)

hgridcent(xbins, xbnds, ybnds, shape, edge.add = 0)
Arguments
- hb
a object of class
"hexbin", typically produced byhexbin(*).- xbnds, ybnds
horizontal and vertical limits of the binning region in x or y units respectively; must be numeric vector of length 2.
- xbins
the number of bins partitioning the range of xbnds.
- shape
the shape = yheight/xwidth of the plotting regions.
- add
a logical value indicating whether or not to add the grid to the current plot.
- fill.edges
integer number of hexagons to add around the border
- fill
the fill color for the hexagons
- border
the color of the border of the hexagons
- edge.add
offset (typically
fill.edgesabove) used inhgridcent.
Details
If a hexbin object is given then the parameters xbins and shape are
ignored. Different bounds can still be specified. The fill.edges
parameter should be an integer. fill.edges takes the current
grid and adds a layer of hexagons around the grid for each level of
fill. So for example if fill.edges= 2 than the dimensions of
the grid would be (i,j)+4.
hgridcent() is the utility function computing the resulting
list (see section “Value”).
WARNING! If using a hexVP be sure to set clip to "on", otherwise the hexagon grid will bleed over the plot edges.
Value
Invisibly returns a list with th following components
- x
The x coordinates of the grid
- y
the y coordinates of the grid
- dimen
a vector of length 2 gining the rows and columns of the grid
- dx
the horizontal diameter of the hexagons
- dy
the vertical diameter of the hexagons
Examples
 x <- rnorm(10000)
 y <- rnorm(10000,x,x)
#> Warning: NAs produced
 hbin <- hexbin(x,y)
 hvp <- plot(hbin,type="n")
 pushHexport(hvp$plot,clip="on")
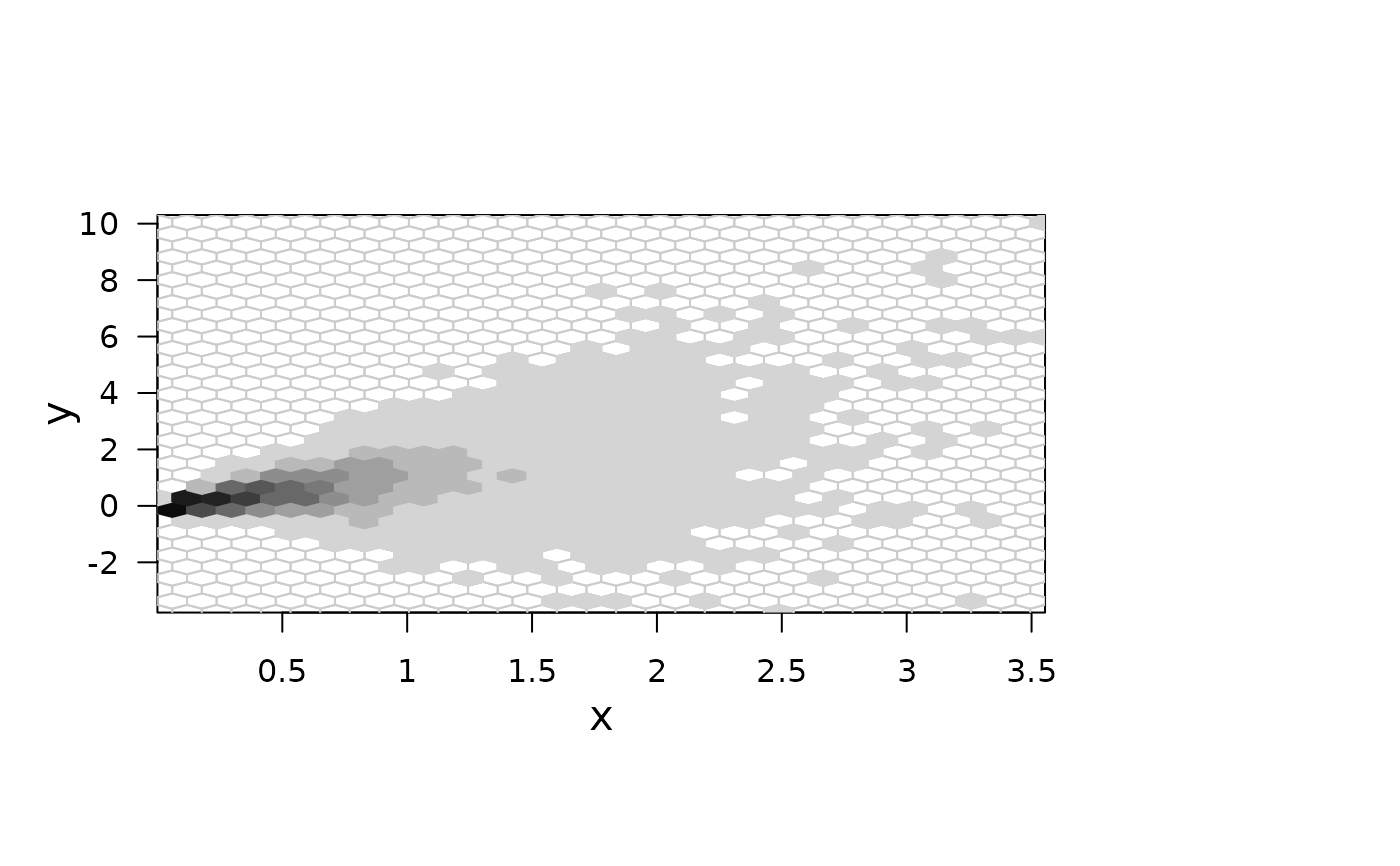
 hexGraphPaper(hbin,border=grey(.8))
 grid.hexagons(hbin)