Plot a triangulation object
plot.triSht.Rdplots the triangulation object "x"
Arguments
- x
object of class
"triSht"- add
logical, if
TRUE, add to a current plot.- do.points
logical, indicates if points should be plotted. (default
TRUE)- do.labels
logical, indicates if points should be labelled. (default
FALSE)- xlim,ylim
x/y ranges for plot
- isometric
generate an isometric plot (default
TRUE)- do.circumcircles
logical, indicates if circumcircles should be plotted (default
FALSE)- segment.lty
line type for triangulation segments
- circle.lty
line type for circumcircles
- ...
additional plot parameters
Author
Albrecht Gebhardt <[email protected]>, Roger Bivand <[email protected]>
Examples
## random points
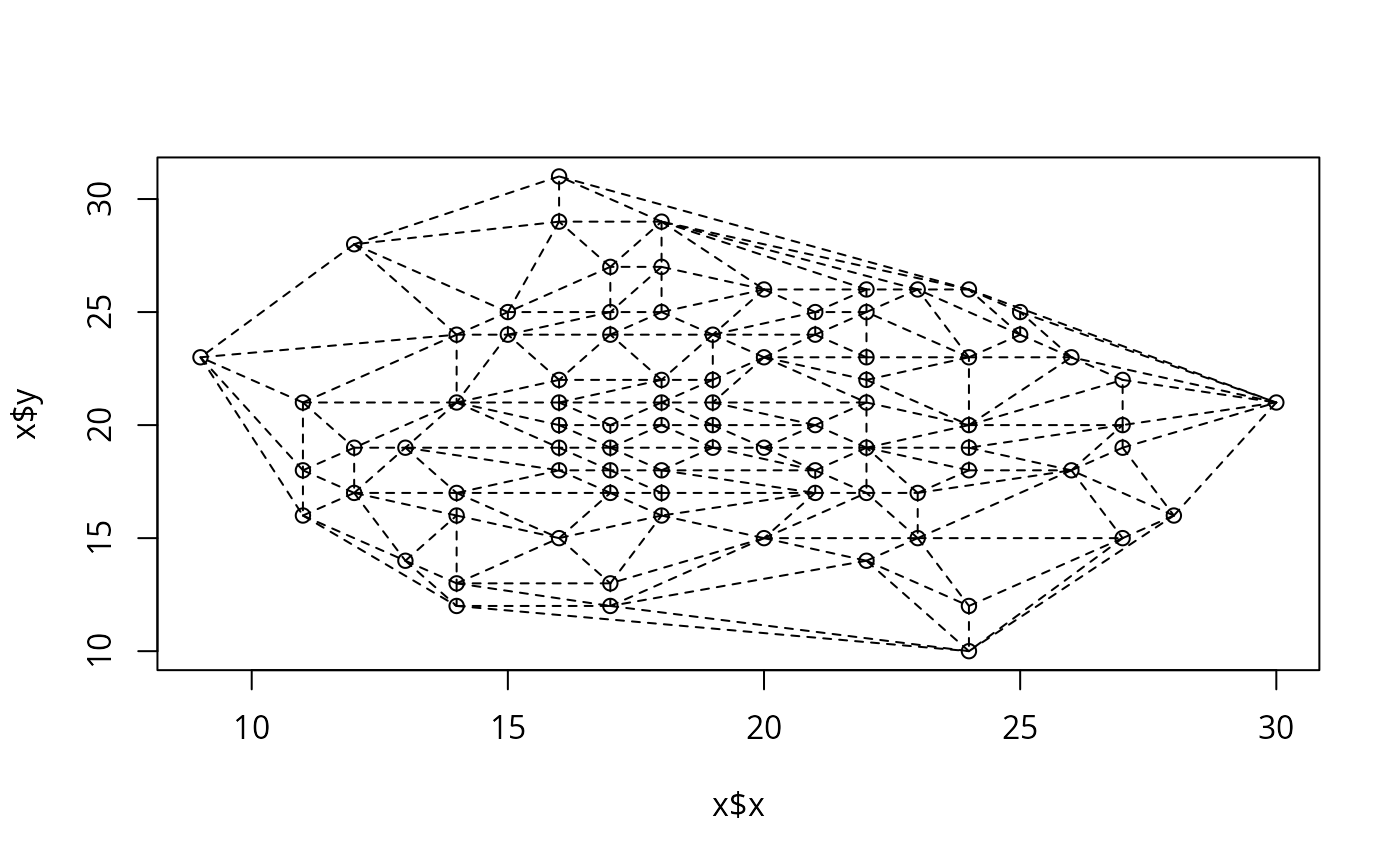
plot(tri.mesh(rpois(100,lambda=20),rpois(100,lambda=20),duplicate="remove"))
 ## use a part of the quakes data set:
data(quakes)
quakes.part<-quakes[(quakes[,1]<=-10.78 & quakes[,1]>=-19.4 &
quakes[,2]<=182.29 & quakes[,2]>=165.77),]
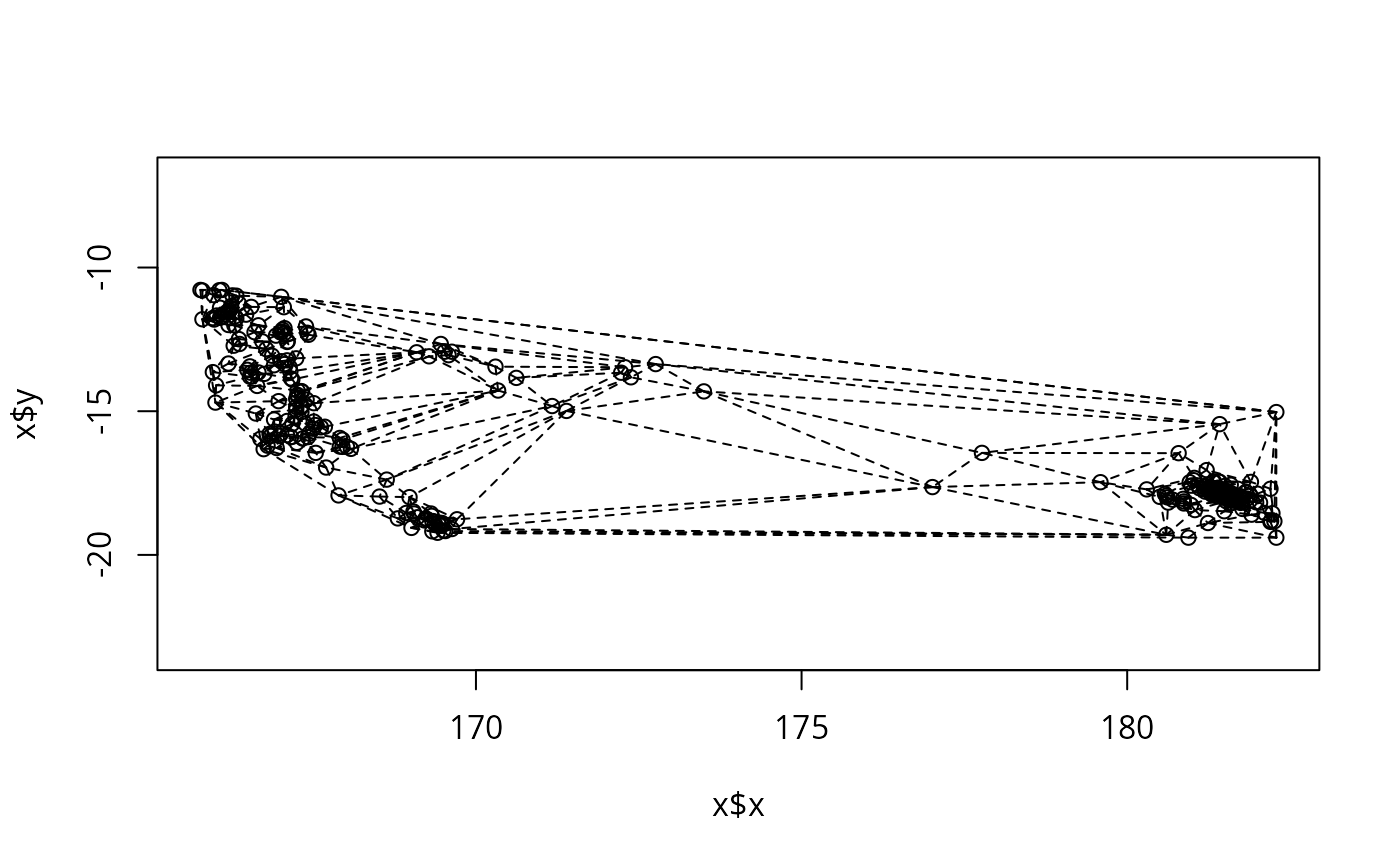
quakes.tri<-tri.mesh(quakes.part$lon, quakes.part$lat, duplicate="remove")
plot(quakes.tri)
## use a part of the quakes data set:
data(quakes)
quakes.part<-quakes[(quakes[,1]<=-10.78 & quakes[,1]>=-19.4 &
quakes[,2]<=182.29 & quakes[,2]>=165.77),]
quakes.tri<-tri.mesh(quakes.part$lon, quakes.part$lat, duplicate="remove")
plot(quakes.tri)
 ## use the whole quakes data set
## (will not work with standard memory settings, hence commented out)
## plot(tri.mesh(quakes$lon, quakes$lat, duplicate="remove"), do.points=F)
## use the whole quakes data set
## (will not work with standard memory settings, hence commented out)
## plot(tri.mesh(quakes$lon, quakes$lat, duplicate="remove"), do.points=F)