Axis labeling
labeling-package.RdFunctions for positioning tick labels on axes
Details
| Package: | labeling |
| Type: | Package |
| Version: | 0.4.3 |
| Date: | 2023-08-29 |
| License: | Unlimited |
| LazyLoad: | yes |
Implements a number of axis labeling schemes, including those compared in An Extension of Wilkinson's Algorithm for Positioning Tick Labels on Axes by Talbot, Lin, and Hanrahan, InfoVis 2010.
References
Heckbert, P. S. (1990) Nice numbers for graph labels, Graphics Gems I, Academic Press Professional, Inc. Wilkinson, L. (2005) The Grammar of Graphics, Springer-Verlag New York, Inc. Talbot, J., Lin, S., Hanrahan, P. (2010) An Extension of Wilkinson's Algorithm for Positioning Tick Labels on Axes, InfoVis 2010.
See also
Examples
heckbert(8.1, 14.1, 4)  # 5 10 15
#> [1]  5 10 15
wilkinson(8.1, 14.1, 4)  # 8 9 10 11 12 13 14 15
#> [1]  8  9 10 11 12 13 14 15
extended(8.1, 14.1, 4)  # 8 10 12 14
#> [1]  8 10 12 14
# When plotting, extend the plot range to include the labeling
# Should probably have a helper function to make this easier
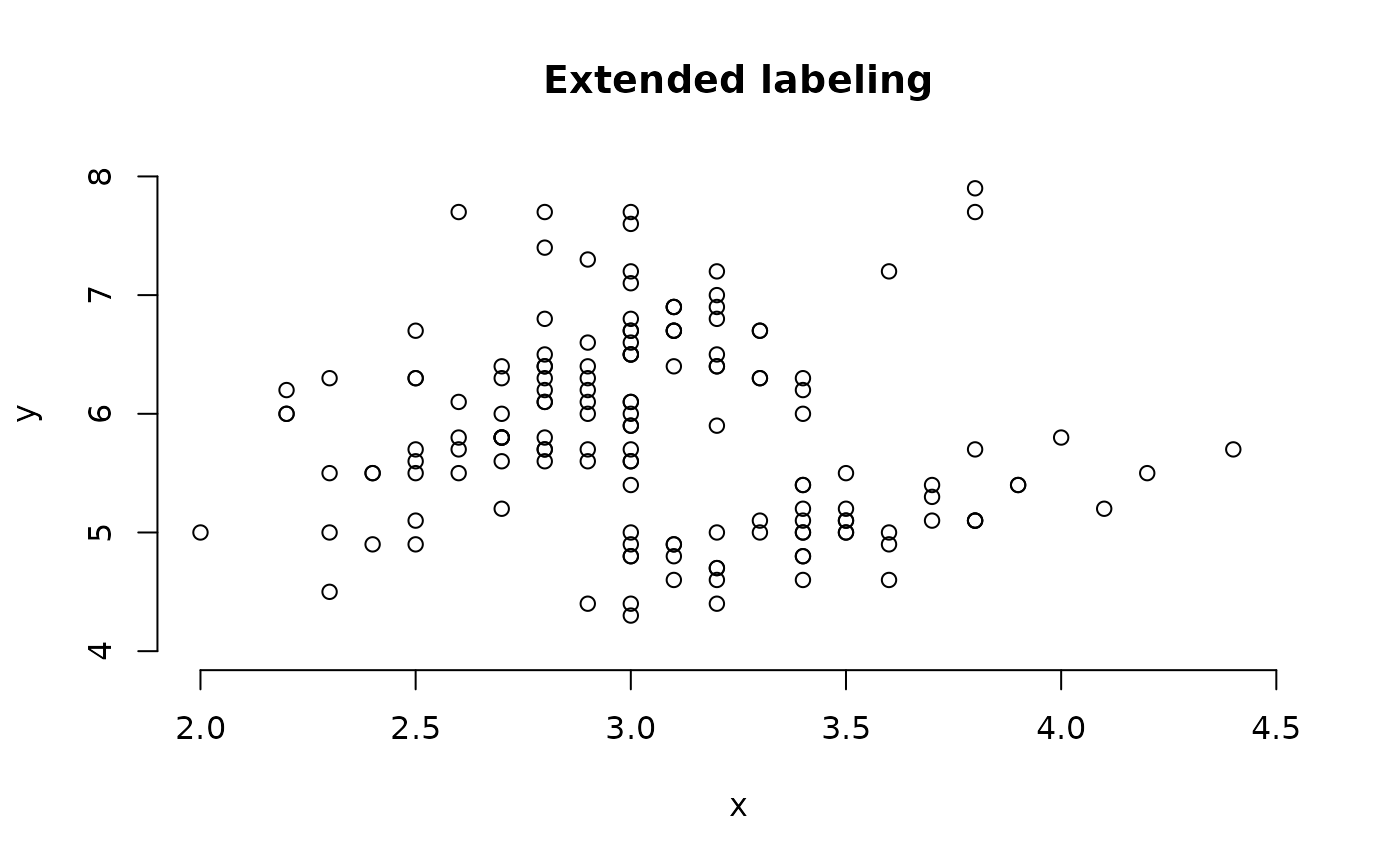
data(iris)
x <- iris$Sepal.Width
y <- iris$Sepal.Length
xl <- extended(min(x), max(x), 6)
yl <- extended(min(y), max(y), 6)
plot(x, y,
    xlim=c(min(x,xl),max(x,xl)),
    ylim=c(min(y,yl),max(y,yl)),
    axes=FALSE, main="Extended labeling")
axis(1, at=xl)
axis(2, at=yl)