Provides a formatted label for use in tikz, svg or Rplot
lav_label_code.RdCreates the code used to show the label in tikz, svg or R. The label is plotted in an xy-plot if show = TRUE.
Usage
lav_label_code(label = "", value = "", show =FALSE,
               idx_font_size = 20L, dy = 7L,
               italic = TRUE, auto_subscript = TRUE)
Arguments
- label
A character string in one of the formats
name
name_index
name=value
name_index=value
If value is specified in parameter
labeland parametervalueis empty, the value inlabelwill be used.- value
A character string specifying a value or empty.
- show
A logical indicating that the result should be plotted in an Rplot.
- idx_font_size
An integer specifying font size to use for the subscript in svg.
- dy
An integer specifying the distance to move the baseline of the subscript in svg.
- italic
A logical indicating whether the label's font should be italic. Only used for tikz output and in the displayed Rplot when the result is not an expression.
- auto_subscript
Logical, if TRUE and
labelstarts with one or more alphabetic chars followed by one or more digits, an underscore will be inserted between these parts.
Details
If both label and value are empty, the resulting codes are
also empty and nothing will be shown.
If label is empty and value is not, processing is done as if
label was specified and value was empty.
If label contains the string "1van", the label value is set to "1".
This allows distinct names for regression intercepts while still labeling
them as "1".
If name in label is a Greek character or varepsilon,
the function attempts to generate code that shows the Greek symbol. If
label contains an index part, the function attempts to generate
code that displays this value as a subscript. In the svg code, the values
idx_font_size and dy are used for the subscript. If a
value is present, the function attempts to show this value after the
label, with an equal sign between the two.
Examples
lav_label_code("x3")
#> $svg
#> [1] "x<tspan dy=\"7\" font-size=\"20\">3</tspan>"
#>
#> $tikz
#> [1] "$x_{3}$"
#>
#> $r
#> expression(x["3"])
#>
lav_label_code("beta10", 0.65, show = TRUE)
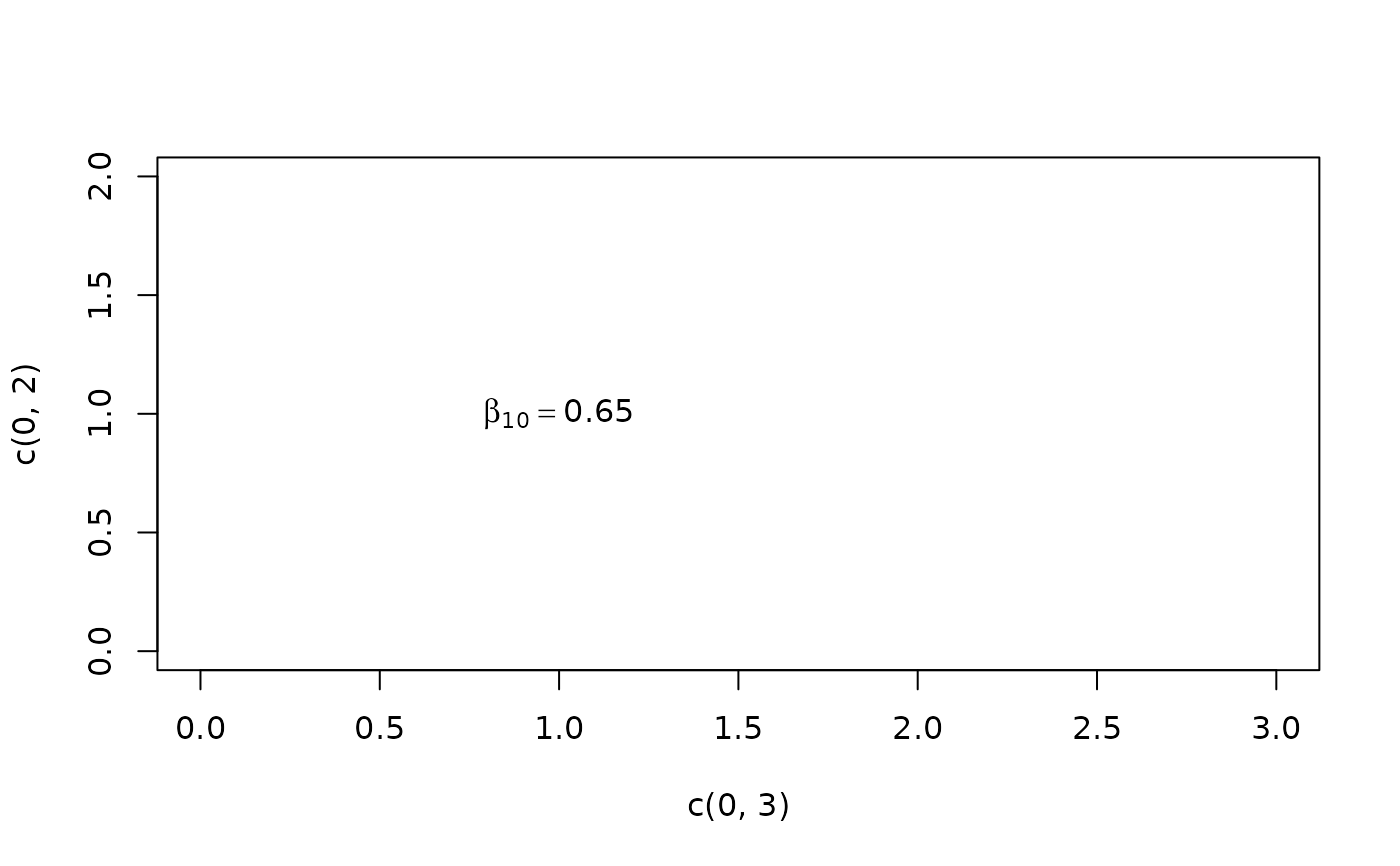 #> $svg
#> [1] "β<tspan dy=\"7\" font-size=\"20\">10</tspan><tspan dy=\"-7\">=0.65</tspan>"
#>
#> $tikz
#> [1] "$\\beta_{10}=0.65$"
#>
#> $r
#> expression(beta["10"] == 0.65)
#>
lav_label_code("A_i,j=0.45", show = TRUE)
#> $svg
#> [1] "β<tspan dy=\"7\" font-size=\"20\">10</tspan><tspan dy=\"-7\">=0.65</tspan>"
#>
#> $tikz
#> [1] "$\\beta_{10}=0.65$"
#>
#> $r
#> expression(beta["10"] == 0.65)
#>
lav_label_code("A_i,j=0.45", show = TRUE)
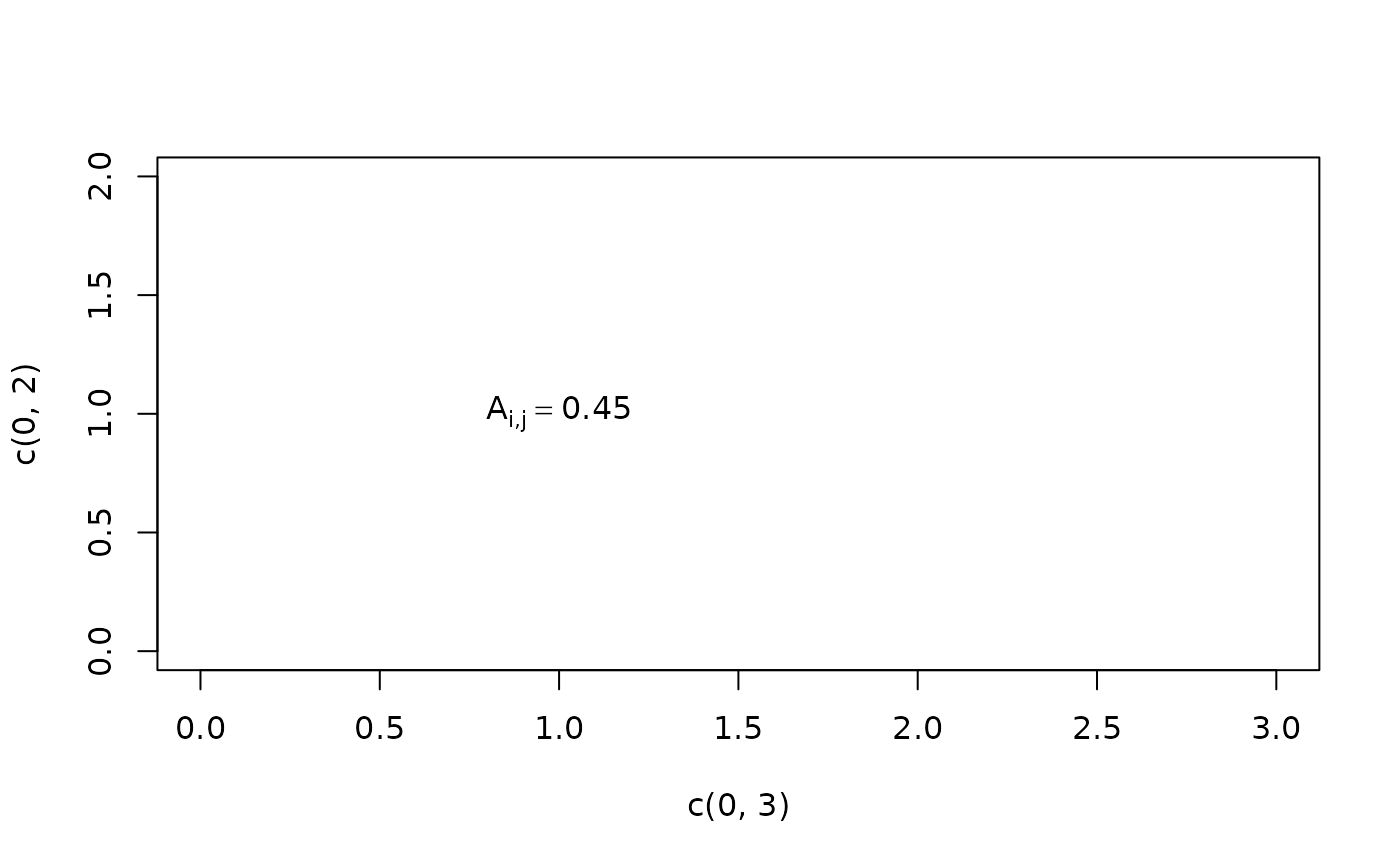 #> $svg
#> [1] "A<tspan dy=\"7\" font-size=\"20\">i,j</tspan><tspan dy=\"-7\">=0.45</tspan>"
#>
#> $tikz
#> [1] "$A_{i,j}=0.45$"
#>
#> $r
#> expression(A["i,j"] == 0.45)
#>
lav_label_code("Gamma")
#> $svg
#> [1] "Γ"
#>
#> $tikz
#> [1] "$\\Gamma$"
#>
#> $r
#> expression(Gamma)
#>
lav_label_code(value="1.2345")
#> $svg
#> [1] "1.2345"
#>
#> $tikz
#> [1] "$1.2345$"
#>
#> $r
#> [1] "1.2345"
#>
#> $svg
#> [1] "A<tspan dy=\"7\" font-size=\"20\">i,j</tspan><tspan dy=\"-7\">=0.45</tspan>"
#>
#> $tikz
#> [1] "$A_{i,j}=0.45$"
#>
#> $r
#> expression(A["i,j"] == 0.45)
#>
lav_label_code("Gamma")
#> $svg
#> [1] "Γ"
#>
#> $tikz
#> [1] "$\\Gamma$"
#>
#> $r
#> expression(Gamma)
#>
lav_label_code(value="1.2345")
#> $svg
#> [1] "1.2345"
#>
#> $tikz
#> [1] "$1.2345$"
#>
#> $r
#> [1] "1.2345"
#>