Add a Confidence Region or Bayesian Credible Region for Regression Lines to a Scatterplot
regcr.RdProduce a confidence or credible region for regression lines based on a sample of bootstrap beta values or posterior beta values. The beta parameters are the intercept and slope from a simple linear regression.
Usage
regcr(beta, x, em.beta = NULL, em.sigma = NULL, alpha = .05,
      nonparametric = FALSE, plot = FALSE, xyaxes = TRUE, ...)
Arguments
- beta
An nx2 matrix of regression parameters. The first column gives the intercepts and the second column gives the slopes.
- x
An n-vector of the predictor variable which is necessary when nonparametric = TRUE.
- em.beta
The estimates for beta required when obtaining confidence regions. This is required for performing the standardization necessary when obtaining nonparametric confidence regions.
- em.sigma
The estimates for the regression standard deviation required when obtaining confidence regions. This is required for performing the standardization necessary when obtaining nonparametric confidence regions.
- alpha
The proportion of the beta sample to remove. In other words, 1-alpha is the level of the credible region.
- nonparametric
If nonparametric = TRUE, then the region is based on the convex hull of the remaining beta after trimming, which is accomplished using a data depth technique. If nonparametric = FALSE, then the region is based on the asymptotic normal approximation.
- plot
If plot = TRUE, lines are added to the existing plot. The type of plot created depends on the value of xyaxes.
- xyaxes
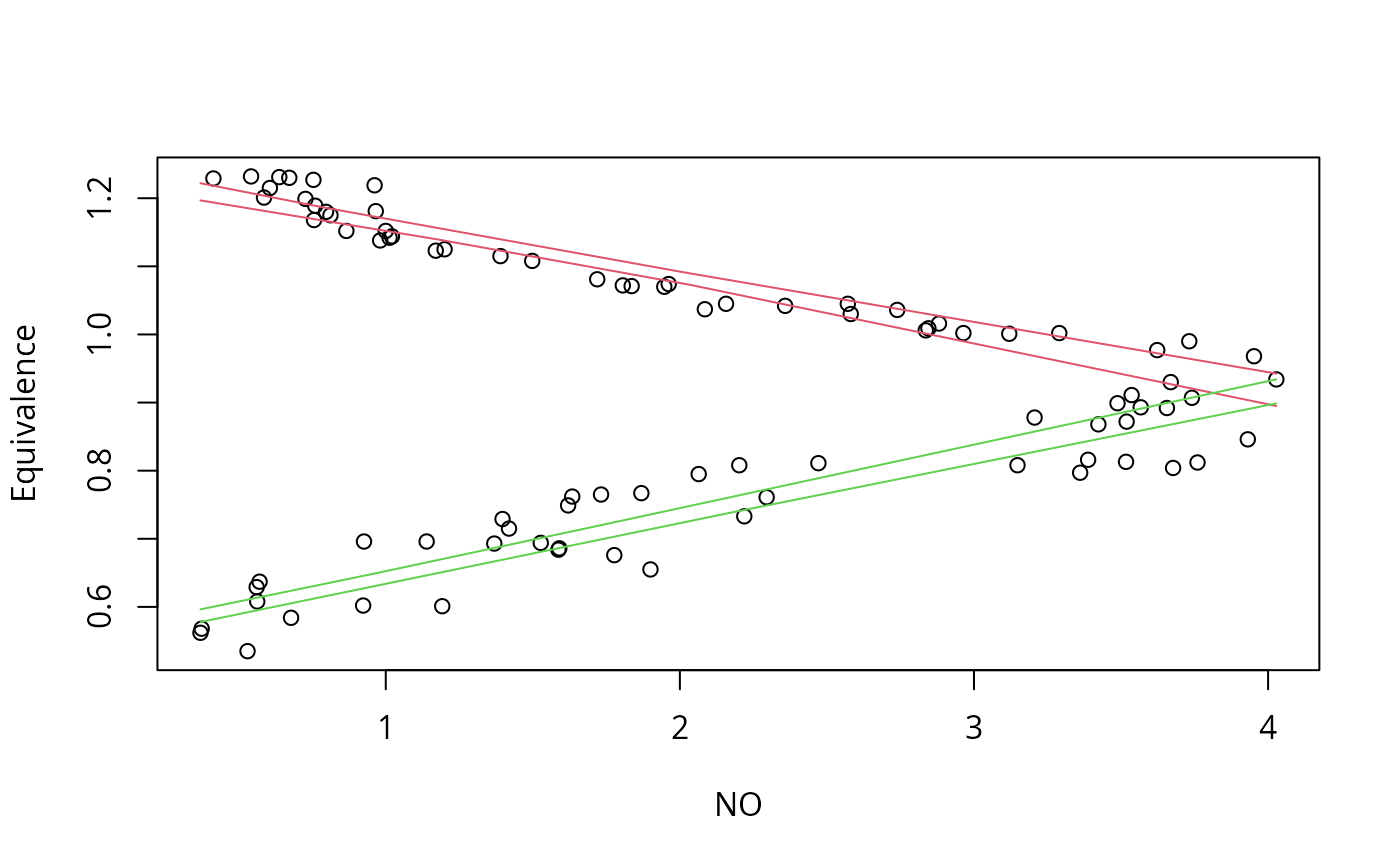
If xyaxes = TRUE and plot = TRUE, then a confidence or credible region for the regression lines is plotted on the x-y axes, presumably overlaid on a scatterplot of the data. If xyaxes = FALSE and plot = TRUE, the (convex) credible region for the regression line is plotted on the beta, or intercept-slope, axes, presumably overlaid on a scatterplot of beta.
- ...
Graphical parameters passed to
linesorplotcommand.
Value
regcr returns a list containing the following items:
- boundary
A matrix of points in beta, or intercept-slope, space arrayed along the boundary of the confidence or credible region.
- upper
A matrix of points in x-y space arrayed along the upper confidence or credible limit for the regression line.
- lower
A matrix of points in x-y space arrayed along the lower confidence or credible limit for the regression line.
Examples
## Nonparametric credible regions fit to NOdata.

data(NOdata)
attach(NOdata)
#> The following objects are masked from NOdata (pos = 6):
#>
#>     Equivalence, NO
#> The following objects are masked from NOdata (pos = 7):
#>
#>     Equivalence, NO
set.seed(100)
beta <- matrix(c(1.3, -0.1, 0.6, 0.1), 2, 2)
sigma <- c(.02, .05)
MH.out <- regmixMH(Equivalence, NO, beta = beta, s = sigma,
                   sampsize = 2500, omega = .0013)
#> Acceptance rate: 39.48%
attach(data.frame(MH.out$theta))
beta.c1 <- cbind(beta0.1[2400:2499], beta1.1[2400:2499])
beta.c2 <- cbind(beta0.2[2400:2499], beta1.2[2400:2499])
plot(NO, Equivalence)
regcr(beta.c1, x = NO, nonparametric = TRUE, plot = TRUE,
      col = 2)
regcr(beta.c2, x = NO, nonparametric = TRUE, plot = TRUE,
      col = 3)