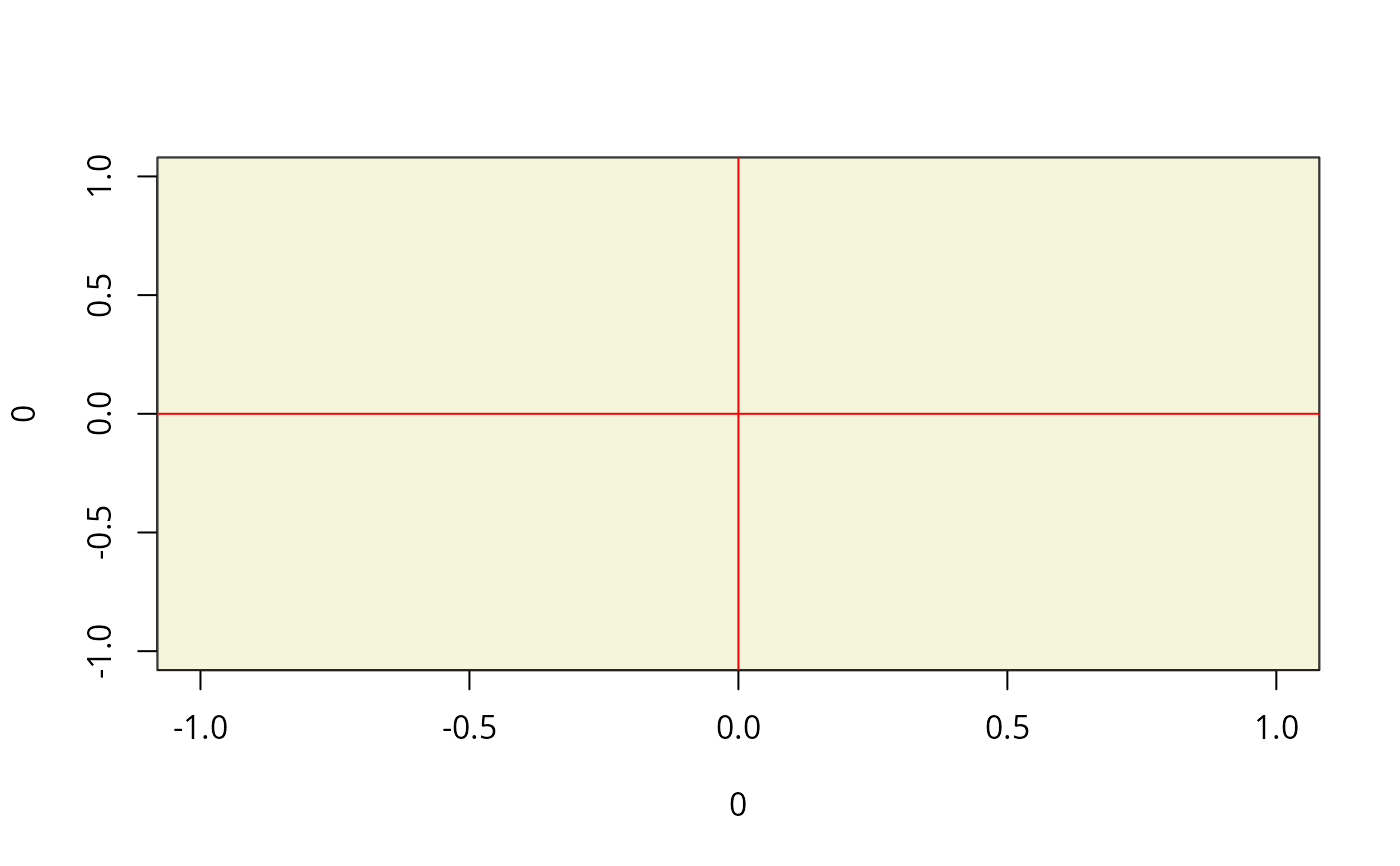
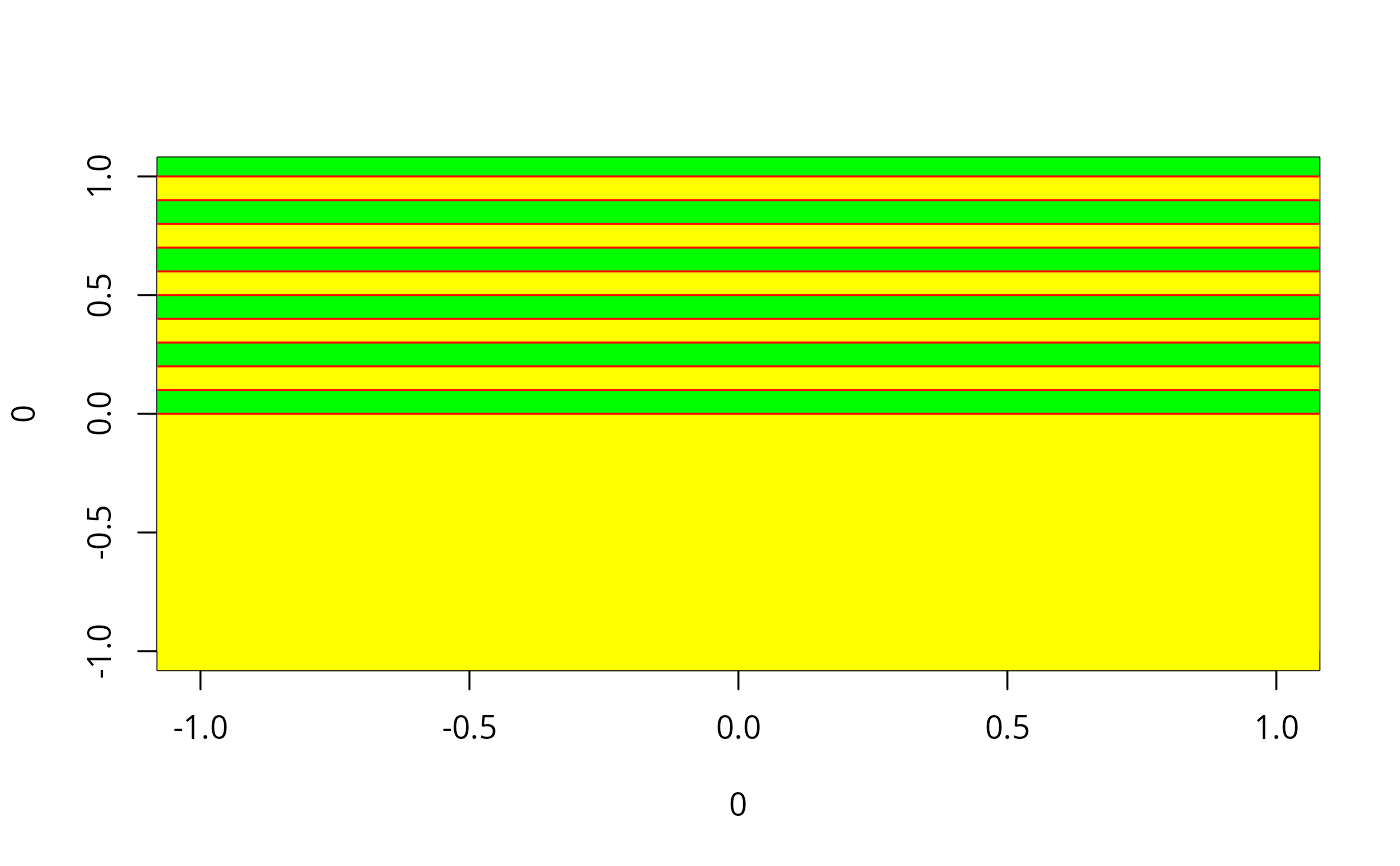
Some users like background colors, and it may be helpful to have grid lines
to read off e.g. probabilities from a Kaplan-Meier graph. Both things can be
controlled with this function. However, it mainly serves
plot.prodlim.
Usage
backGround(
  xlim,
  ylim,
  bg = "white",
  fg = "gray77",
  horizontal = NULL,
  vertical = NULL,
  border = "black"
)
Arguments
- xlim
Limits for the xaxis, defaults to par("usr")[1:2].
- ylim
Limits for the yaxis, defaults to par("usr")[3:4].
- bg
Background color. Can be multiple colors which are then switched at each horizontal line.
- fg
Grid line color.
- horizontal
Numerical values at which horizontal grid lines are plotted.
- vertical
Numerical values at which vertical grid lines are plotted.
- border
The color of the border around the background.
Author
Thomas Alexander Gerds <[email protected]>