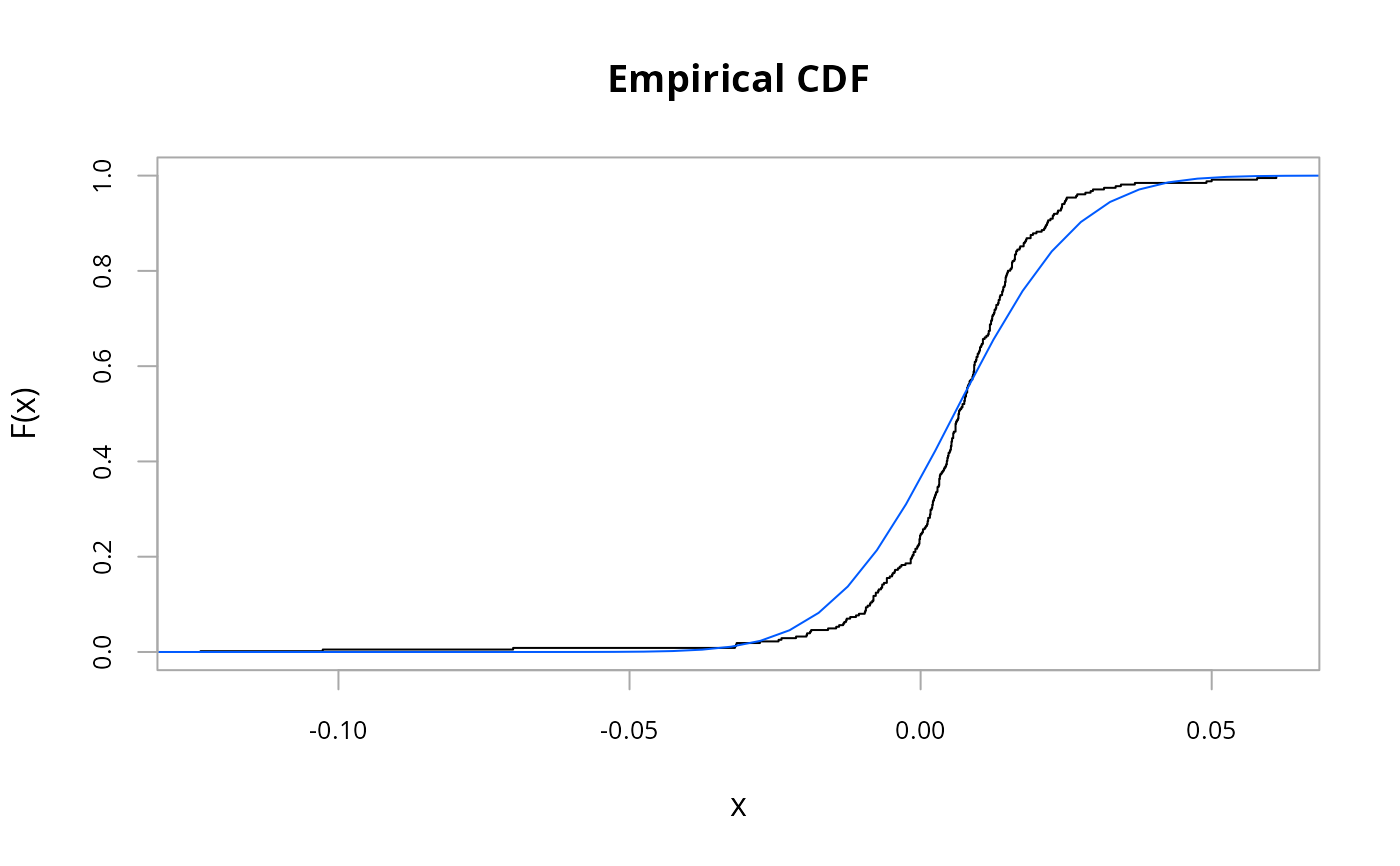
Creates an emperical cumulative distribution function (ECDF) overlaid with a cumulative distribution function (CDF)
Arguments
- R
an xts, vector, matrix, data frame, timeSeries or zoo object of asset returns
- main
set the chart title, same as in
plot- xlab
set the x-axis label, same as in
plot- ylab
set the y-axis label, same as in
plot- colorset
color palette to use, defaults to c("black", "#005AFF"), where first value is used to color the step function and the second color is used for the fitted normal
- lwd
set the line width, same as in
plot- lty
set the line type, same as in
plot- element.color
specify the color of chart elements. Default is "darkgray"
- xaxis
if true, draws the x axis
- yaxis
if true, draws the y axis
- ...
any other passthru parameters to
plot
Details
The empirical cumulative distribution function (ECDF for short) calculates
the fraction of observations less or equal to a given value. The resulting
plot is a step function of that fraction at each observation. This function
uses ecdf and overlays the CDF for a fitted normal function as well.
Inspired by a chart in Ruppert (2004).
Examples
data(edhec)
chart.ECDF(edhec[, 1, drop=FALSE])