**PerformanceAnalytics** Plotting Using Additional Plotting Engines
features added in GSoC 2019
Zeheng ‘Zenith’ Zhou, Justin M. Shea, and Brian G. Peterson
Source:vignettes/Graphing-Engine-2019-Features.Rmd
Graphing-Engine-2019-Features.RmdMultiple Plotting Engine
The main purpose of this update is to add multiple plotting engines into the current plotting functions. Functions modified for now are: - chart.Boxplot - chart.TimeSeries - chart.CumReturns - chart.Drawdown - charts.PerformanceSummary
The engines added onto the functions are: - ggplot2 (plot.engine = “ggplot2”) - dygraphPlot (plot.engine = “dygraph”) - googleVis (plot.engine = “googlevis”) - plotly (plotly)
A demo of different plot engines in different functions will be shown as below:
chart.Boxplot
This function includes plotting engine: “ggplot2”,“plotly”.
plotly
chart.Boxplot(edhec, plot.engine = "plotly", main="demo")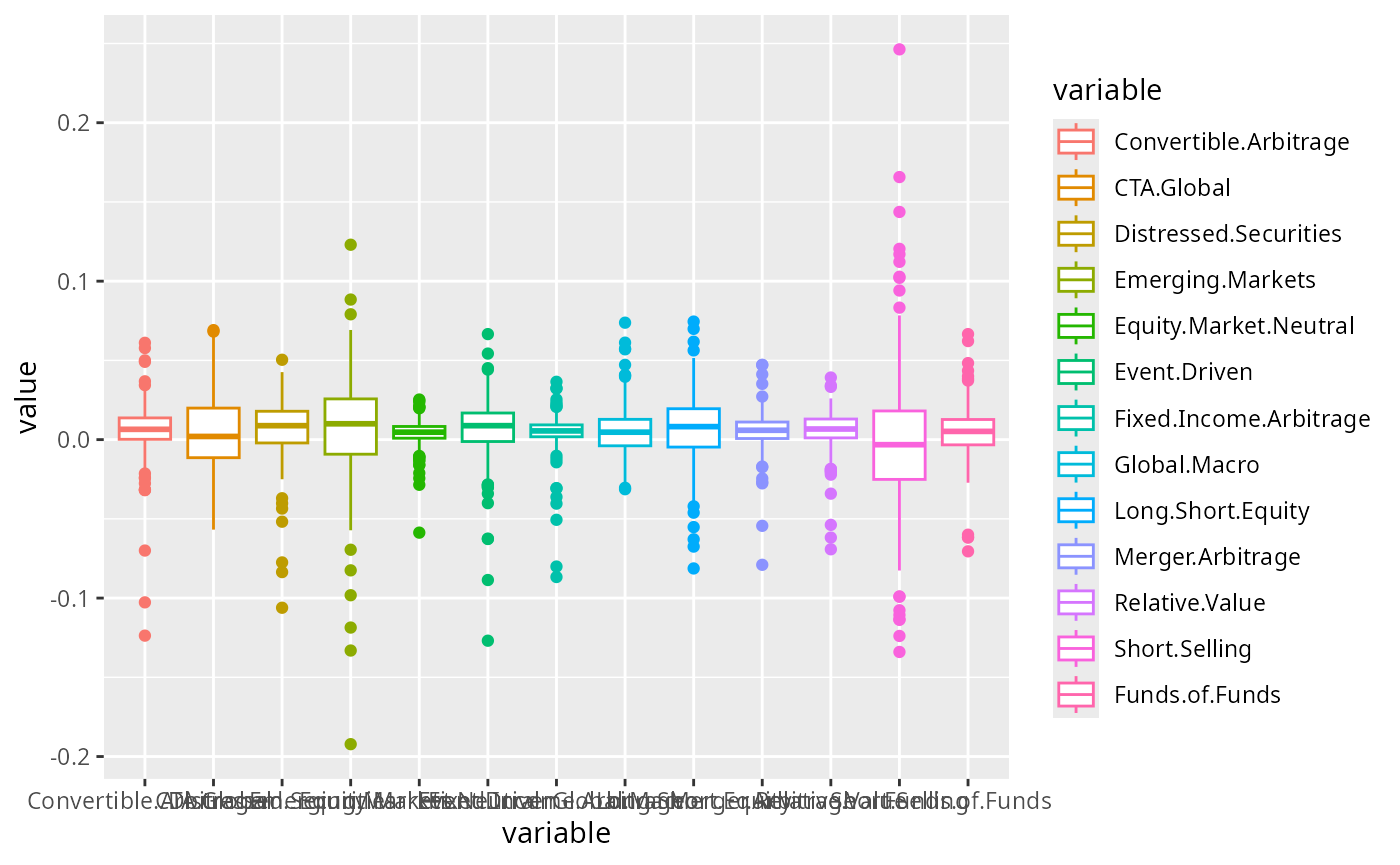
chart.TimeSeries
This function includes plotting engine: “ggplot2”,“plotly”,“googlevis”,“dygraph”
dygraphPlot
chart.TimeSeries(edhec,plot.engine = "dygraph",main="demo")plotly
chart.TimeSeries(edhec,plot.engine = "plotly",main="demo")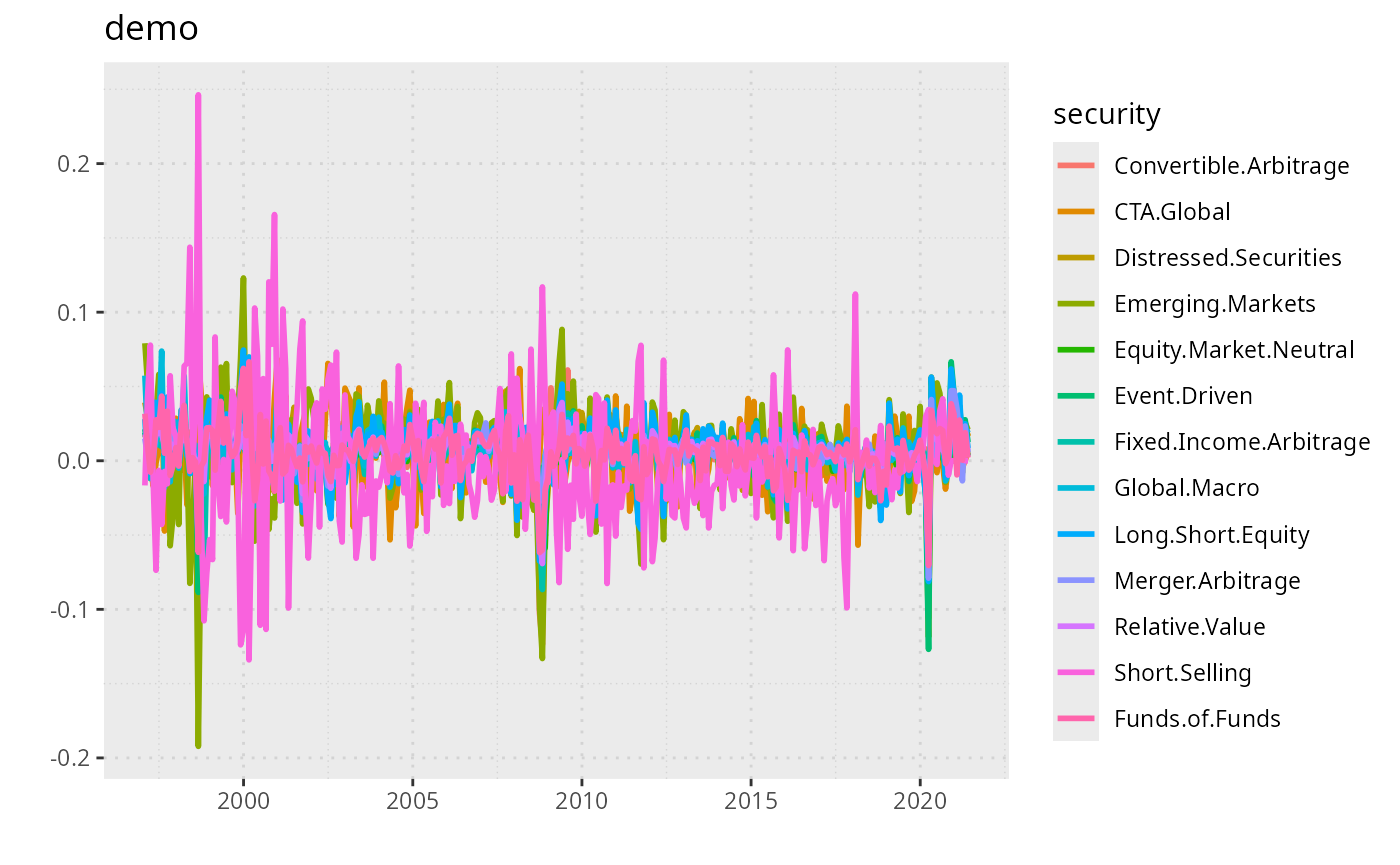
chart.CumReturns
This function includes plotting engine:
plotly,googlevis,dygraph, and
ggplot2
dygraphPlot
chart.CumReturns(edhec,plot.engine = "dygraph",main="demo")plotly
chart.CumReturns(edhec,plot.engine = "plotly",main="demo")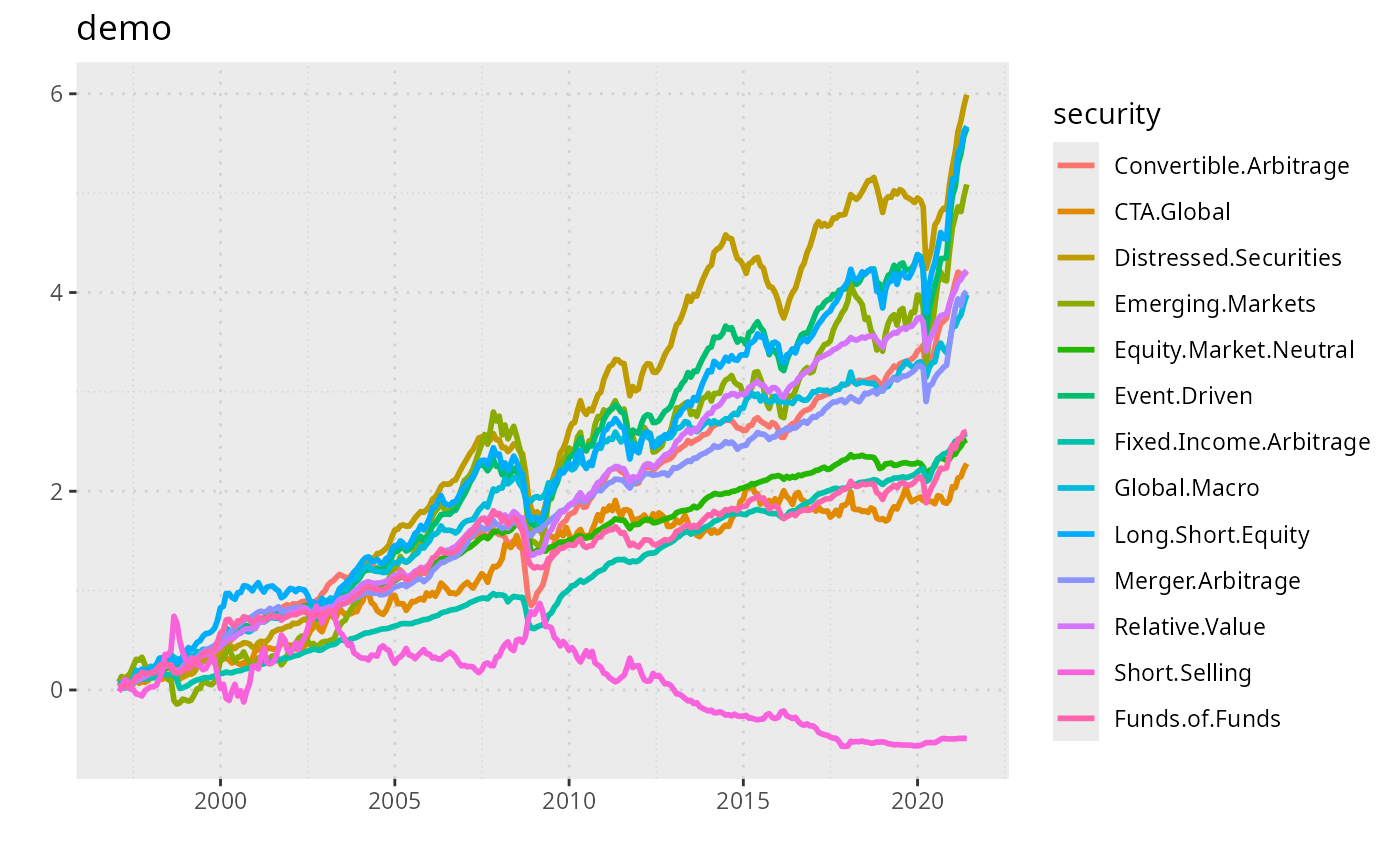
chart.Drawdown
This function includes plotting engine: “ggplot2”,“plotly”,“googlevis”,“dygraph”
dygraphPlot
chart.Drawdown(edhec,plot.engine = "dygraph",main="demo")plotly
chart.Drawdown(edhec,plot.engine = "plotly",main="demo")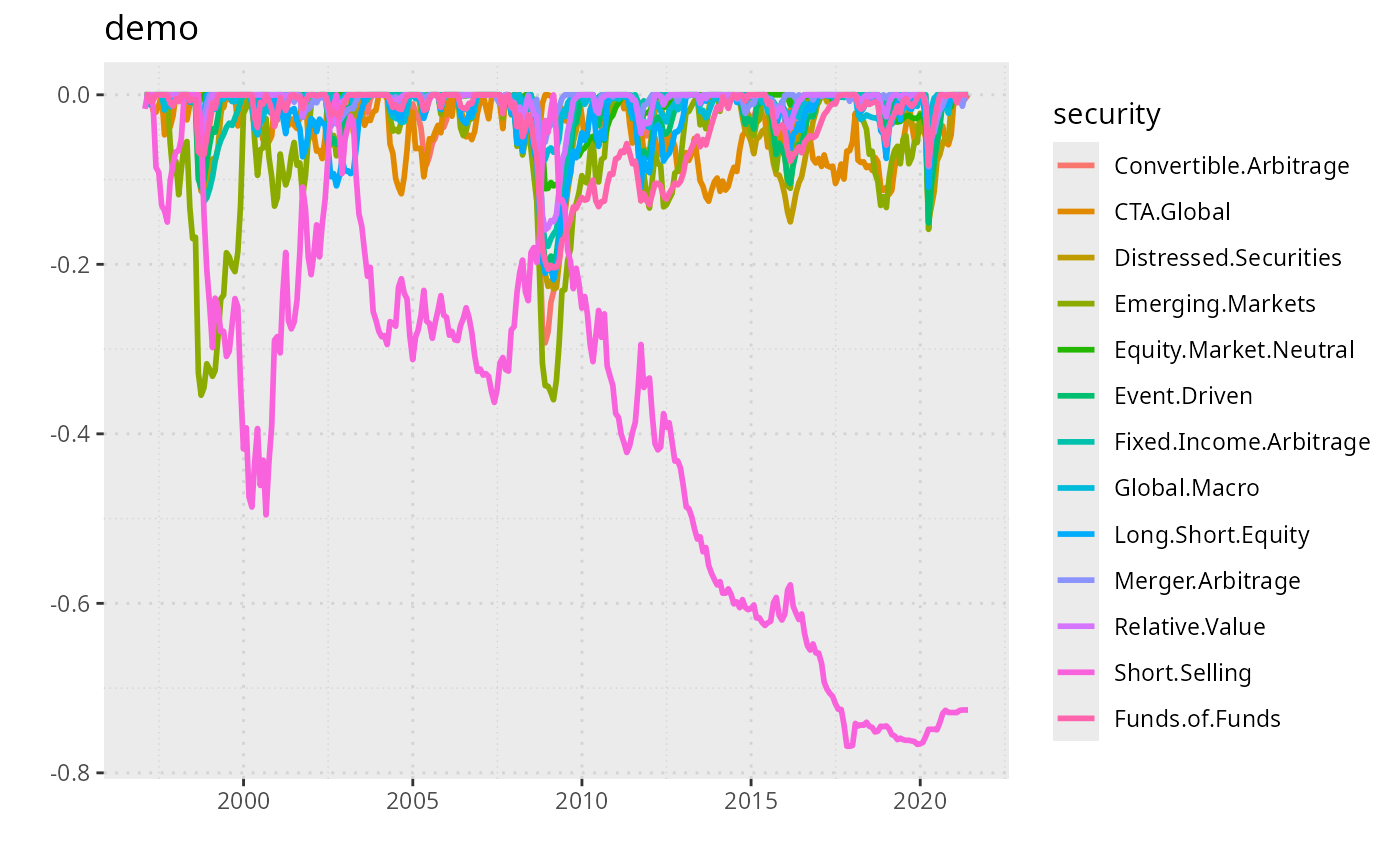
charts.PerformanceSummary
This function includes plotting engine: “ggplot2”,“plotly”
plotly
charts.PerformanceSummary(edhec,plot.engine = "plotly",main="demo")ggplot2
charts.PerformanceSummary(edhec,plot.engine = "ggplot2",main="demo")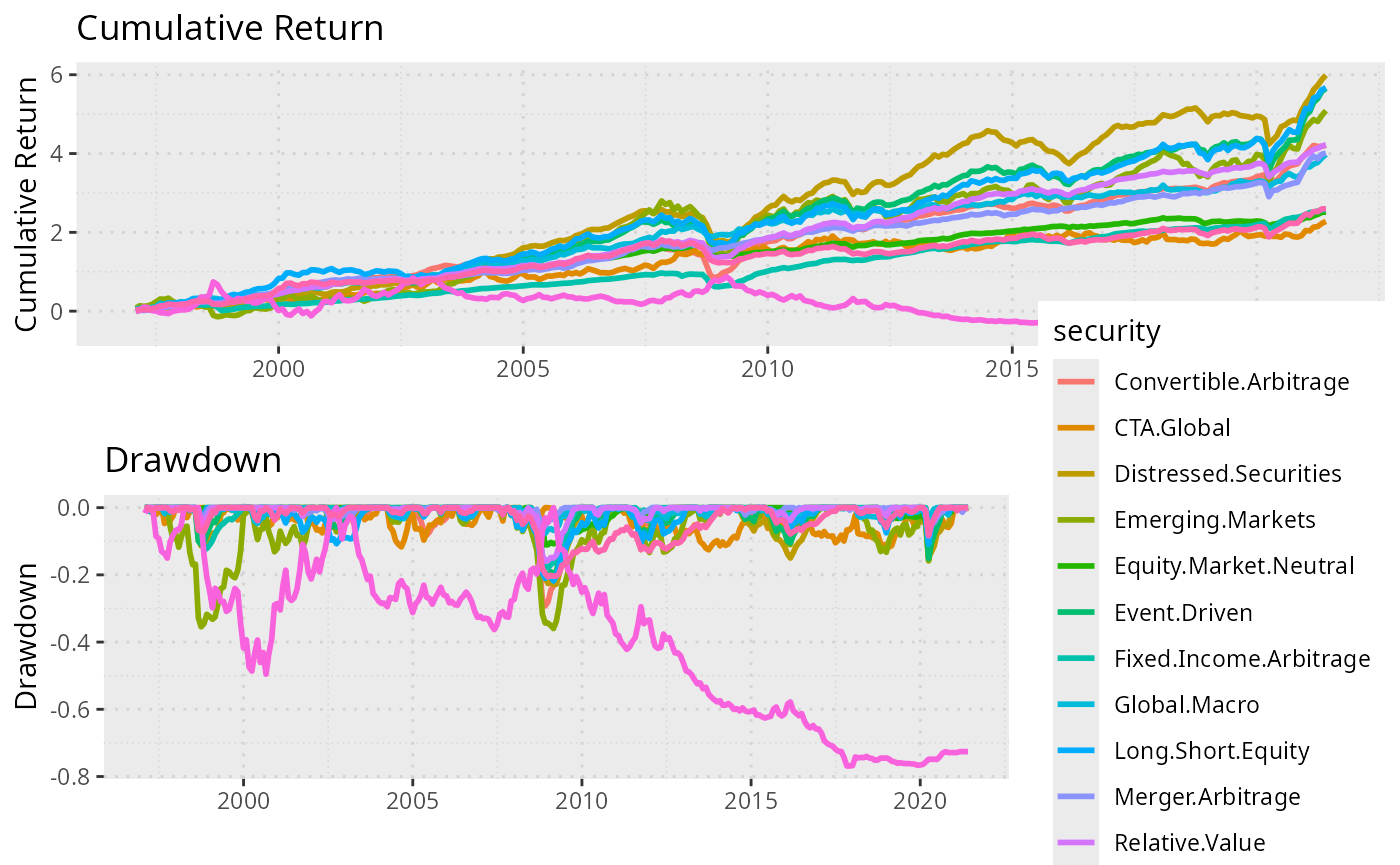
## TableGrob (2 x 1) "arrange": 2 grobs
##   z     cells    name           grob
## 1 1 (1-1,1-1) arrange gtable[layout]
## 2 2 (2-2,1-1) arrange gtable[layout]