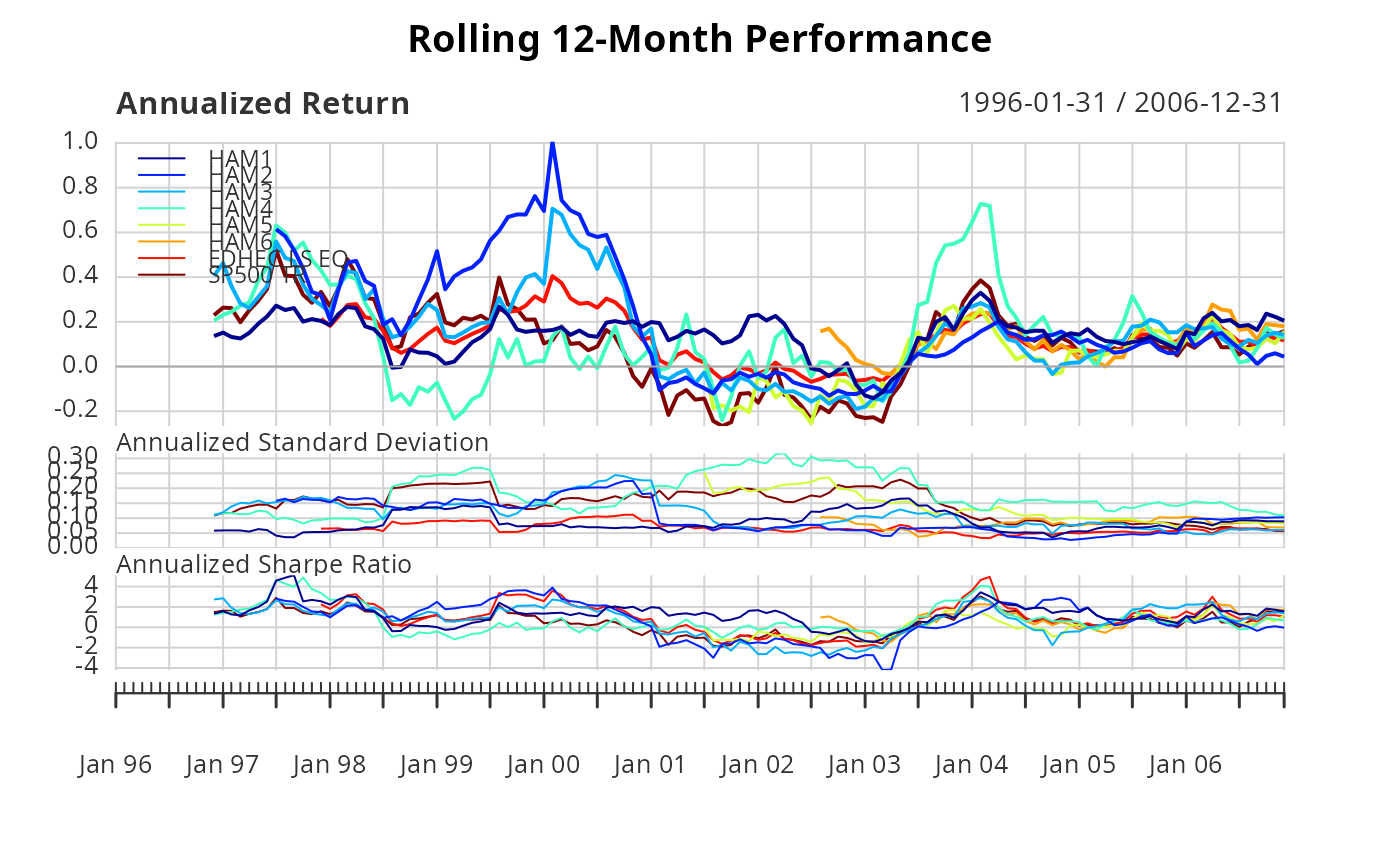
A wrapper to create a rolling annualized returns chart, rolling annualized standard deviation chart, and a rolling annualized sharpe ratio chart.
Usage
charts.RollingPerformance(
  R,
  width = 12,
  Rf = 0,
  main = NULL,
  event.labels = NULL,
  legend.loc = NULL,
  ...
)
Arguments
- R
an xts, vector, matrix, data frame, timeSeries or zoo object of asset returns
- width
number of periods to apply rolling function over
- Rf
risk free rate, in same period as your returns
- main
set the chart title, same as in
plot- event.labels
TRUE/FALSE whether or not to display lines and labels for historical market shock events
- legend.loc
places a legend into one of nine locations on the chart: bottomright, bottom, bottomleft, left, topleft, top, topright, right, or center.
- ...
any other passthru parameters
Examples
# \donttest{
data(managers)
charts.RollingPerformance(managers[,1:8],
Rf=managers[,10,drop=FALSE],
colorset=tim8equal,
main="Rolling 12-Month Performance",
legend.loc="topleft")
 # }
# }