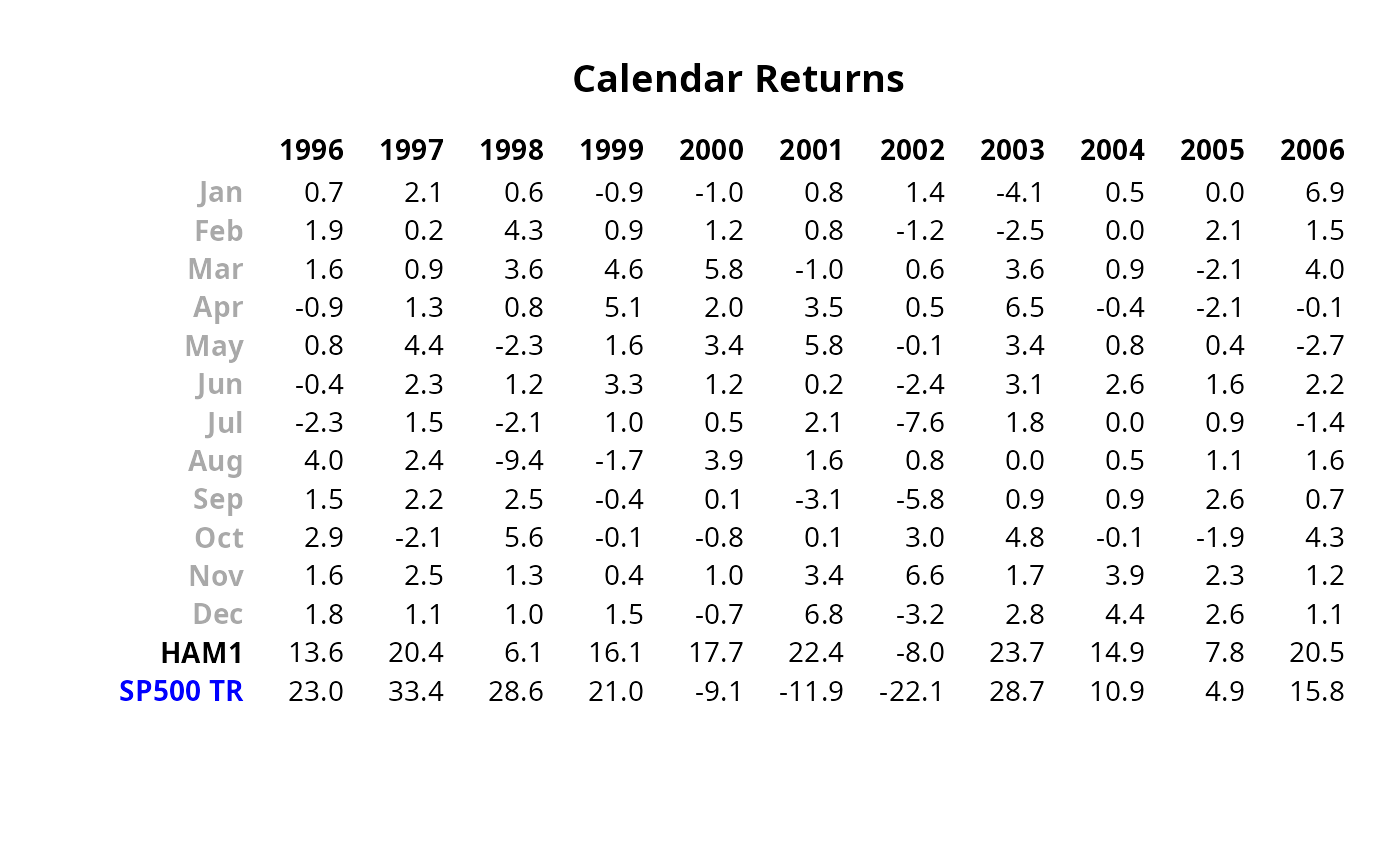
Returns a table of returns formatted with years in rows, months in columns,
and a total column in the last column. For additional columns in R,
annual returns will be appended as columns.
Arguments
- R
an xts, vector, matrix, data frame, timeSeries or zoo object of monthly or daily asset returns
- digits
number of digits to round results to for presentation
- as.perc
TRUE/FALSE if TRUE, multiply simple returns by 100 to get %
- geometric
utilize geometric chaining (TRUE) or simple/arithmetic chaining (FALSE) to aggregate returns, default TRUE
Note
This function assumes monthly returns or daily returns and does not have handling for other periodicities
This function defaults to the first column as the monthly returns to be formatted.
Examples
data(managers)
t(table.CalendarReturns(managers[,c(1,7,8)]))
#>             1996 1997 1998 1999 2000  2001  2002 2003 2004 2005 2006
#> Jan          0.7  2.1  0.6 -0.9 -1.0   0.8   1.4 -4.1  0.5  0.0  6.9
#> Feb          1.9  0.2  4.3  0.9  1.2   0.8  -1.2 -2.5  0.0  2.1  1.5
#> Mar          1.6  0.9  3.6  4.6  5.8  -1.0   0.6  3.6  0.9 -2.1  4.0
#> Apr         -0.9  1.3  0.8  5.1  2.0   3.5   0.5  6.5 -0.4 -2.1 -0.1
#> May          0.8  4.4 -2.3  1.6  3.4   5.8  -0.1  3.4  0.8  0.4 -2.7
#> Jun         -0.4  2.3  1.2  3.3  1.2   0.2  -2.4  3.1  2.6  1.6  2.2
#> Jul         -2.3  1.5 -2.1  1.0  0.5   2.1  -7.6  1.8  0.0  0.9 -1.4
#> Aug          4.0  2.4 -9.4 -1.7  3.9   1.6   0.8  0.0  0.5  1.1  1.6
#> Sep          1.5  2.2  2.5 -0.4  0.1  -3.1  -5.8  0.9  0.9  2.6  0.7
#> Oct          2.9 -2.1  5.6 -0.1 -0.8   0.1   3.0  4.8 -0.1 -1.9  4.3
#> Nov          1.6  2.5  1.3  0.4  1.0   3.4   6.6  1.7  3.9  2.3  1.2
#> Dec          1.8  1.1  1.0  1.5 -0.7   6.8  -3.2  2.8  4.4  2.6  1.1
#> HAM1        13.6 20.4  6.1 16.1 17.7  22.4  -8.0 23.7 14.9  7.8 20.5
#> EDHEC LS EQ   NA 21.4 14.6 31.4 12.0  -1.2  -6.4 19.3  8.6 11.3 11.7
#> SP500 TR    23.0 33.4 28.6 21.0 -9.1 -11.9 -22.1 28.7 10.9  4.9 15.8

 # don't test on CRAN, since it requires Suggested packages

# prettify with format.df in hmisc package
require("Hmisc")
result = t(table.CalendarReturns(managers[,c(1,8)]))

textplot(format.df(result, na.blank=TRUE, numeric.dollar=FALSE,
         cdec=rep(1,dim(result)[2])), rmar = 0.8, cmar = 1,
         max.cex=.9, halign = "center", valign = "top",
         row.valign="center", wrap.rownames=20, wrap.colnames=10,
         col.rownames=c( rep("darkgray",12), "black", "blue"),
         mar = c(0,0,3,0)+0.1)

title(main="Calendar Returns")