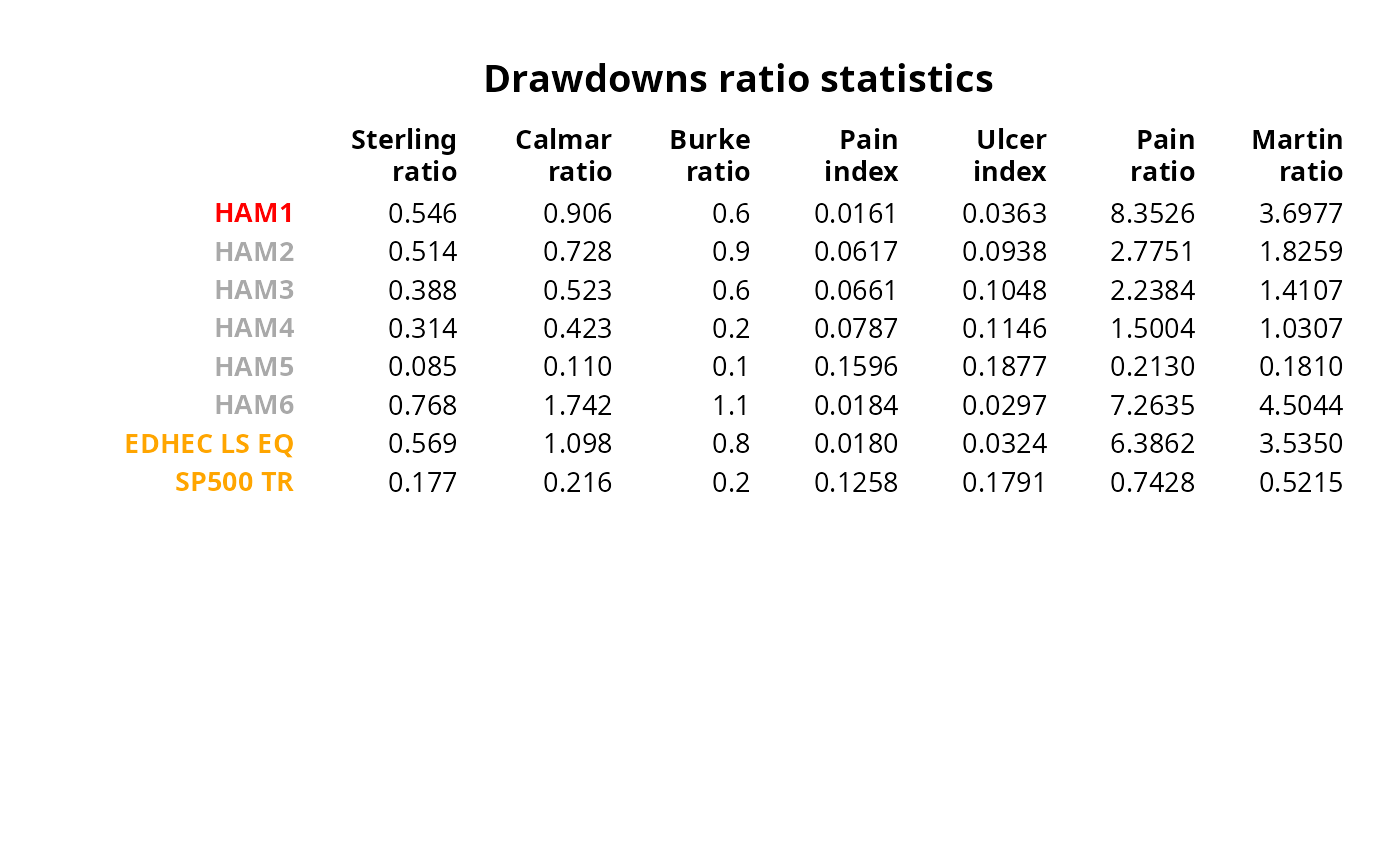
Table of Calmar ratio, Sterling ratio, Burke ratio, Pain index, Ulcer index, Pain ratio and Martin ratio
References
Carl Bacon, Practical portfolio performance measurement and attribution, second edition 2008 p.93
Examples
data(managers)
table.DrawdownsRatio(managers[,1:8])
#>                  HAM1   HAM2   HAM3   HAM4   HAM5   HAM6 EDHEC LS EQ SP500 TR
#> Sterling ratio 0.5463 0.5139 0.3884 0.3136 0.0847 0.7678      0.5688   0.1768
#> Calmar ratio   0.9062 0.7281 0.5226 0.4227 0.1096 1.7425      1.0982   0.2163
#> Burke ratio    0.6593 0.8970 0.6079 0.1998 0.1008 1.0788      0.8452   0.2191
#> Pain index     0.0161 0.0617 0.0661 0.0787 0.1596 0.0184      0.0180   0.1258
#> Ulcer index    0.0363 0.0938 0.1048 0.1146 0.1877 0.0297      0.0324   0.1791
#> Pain ratio     8.5601 2.8291 2.2889 1.5427 0.2339 7.4443      6.5718   0.7693
#> Martin ratio   3.7895 1.8615 1.4425 1.0598 0.1988 4.6165      3.6377   0.5401

 # don't test on CRAN, since it requires Suggested packages

require("Hmisc")
result = t(table.DrawdownsRatio(managers[,1:8], Rf=.04/12))

textplot(format.df(result, na.blank=TRUE, numeric.dollar=FALSE, cdec=c(3,3,1)),
rmar = 0.8, cmar = 2,  max.cex=.9, halign = "center", valign = "top",
row.valign="center", wrap.rownames=20, wrap.colnames=10,
col.rownames=c("red", rep("darkgray",5), rep("orange",2)), mar = c(0,0,3,0)+0.1)
title(main="Drawdowns ratio statistics")