Returns Summary: Statistics and Stylized Facts
Source:R/table.MonthlyReturns.R
table.MonthlyReturns.RdReturns a basic set of statistics that match the period of the data passed in (e.g., monthly returns will get monthly statistics, daily will be daily stats, and so on)
Details
This was created as a way to display a set of related statistics together for comparison across a set of instruments or funds. Careful consideration to missing data or unequal time series should be given when intepreting the results.
Examples
data(edhec)
table.Stats(edhec[,1:3])
#>                 Convertible Arbitrage CTA Global Distressed Securities
#> Observations                 293.0000   293.0000              293.0000
#> NAs                            0.0000     0.0000                0.0000
#> Minimum                       -0.1237    -0.0568               -0.1061
#> Quartile 1                     0.0002    -0.0114               -0.0021
#> Median                         0.0065     0.0020                0.0088
#> Arithmetic Mean                0.0058     0.0043                0.0068
#> Geometric Mean                 0.0056     0.0041                0.0067
#> Quartile 3                     0.0137     0.0199                0.0179
#> Maximum                        0.0611     0.0691                0.0504
#> SE Mean                        0.0010     0.0013                0.0011
#> LCL Mean (0.95)                0.0039     0.0017                0.0047
#> UCL Mean (0.95)                0.0077     0.0069                0.0089
#> Variance                       0.0003     0.0005                0.0003
#> Stdev                          0.0168     0.0228                0.0181
#> Skewness                      -2.5970     0.1628               -1.7283
#> Kurtosis                      18.6011    -0.0076                7.7946
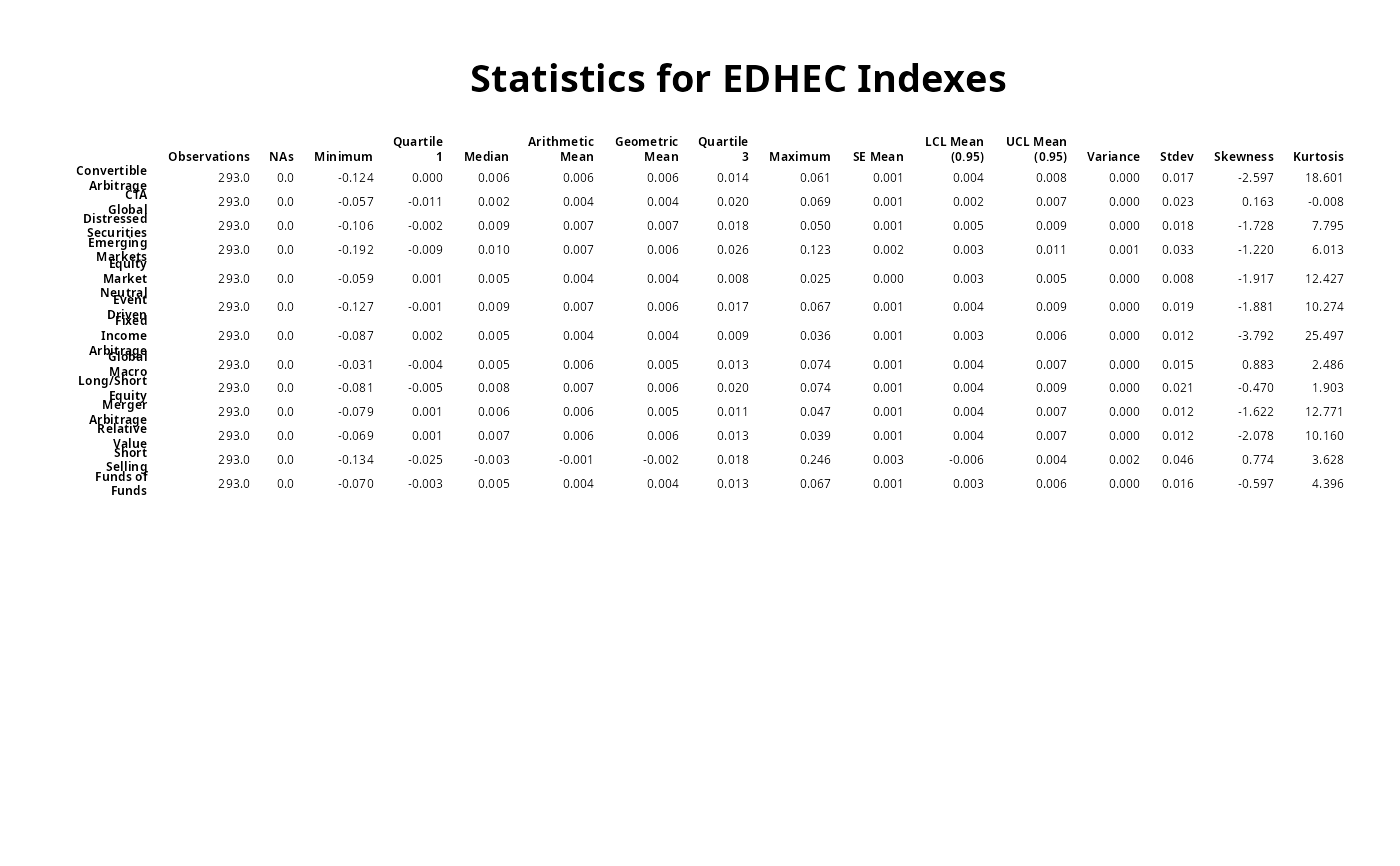
t(table.Stats(edhec))
#>                        Observations NAs Minimum Quartile 1  Median
#> Convertible Arbitrage           293   0 -0.1237     0.0002  0.0065
#> CTA Global                      293   0 -0.0568    -0.0114  0.0020
#> Distressed Securities           293   0 -0.1061    -0.0021  0.0088
#> Emerging Markets                293   0 -0.1922    -0.0092  0.0100
#> Equity Market Neutral           293   0 -0.0587     0.0009  0.0047
#> Event Driven                    293   0 -0.1269    -0.0012  0.0088
#> Fixed Income Arbitrage          293   0 -0.0867     0.0018  0.0055
#> Global Macro                    293   0 -0.0313    -0.0039  0.0047
#> Long/Short Equity               293   0 -0.0813    -0.0047  0.0082
#> Merger Arbitrage                293   0 -0.0790     0.0007  0.0059
#> Relative Value                  293   0 -0.0692     0.0011  0.0067
#> Short Selling                   293   0 -0.1340    -0.0251 -0.0032
#> Funds of Funds                  293   0 -0.0705    -0.0033  0.0052
#>                        Arithmetic Mean Geometric Mean Quartile 3 Maximum
#> Convertible Arbitrage           0.0058         0.0056     0.0137  0.0611
#> CTA Global                      0.0043         0.0041     0.0199  0.0691
#> Distressed Securities           0.0068         0.0067     0.0179  0.0504
#> Emerging Markets                0.0067         0.0062     0.0257  0.1230
#> Equity Market Neutral           0.0043         0.0043     0.0083  0.0253
#> Event Driven                    0.0067         0.0065     0.0168  0.0666
#> Fixed Income Arbitrage          0.0044         0.0044     0.0093  0.0365
#> Global Macro                    0.0056         0.0055     0.0128  0.0738
#> Long/Short Equity               0.0067         0.0065     0.0195  0.0745
#> Merger Arbitrage                0.0056         0.0055     0.0111  0.0472
#> Relative Value                  0.0057         0.0057     0.0130  0.0392
#> Short Selling                  -0.0013        -0.0023     0.0181  0.2463
#> Funds of Funds                  0.0045         0.0044     0.0127  0.0666
#>                        SE Mean LCL Mean (0.95) UCL Mean (0.95) Variance  Stdev
#> Convertible Arbitrage   0.0010          0.0039          0.0077   0.0003 0.0168
#> CTA Global              0.0013          0.0017          0.0069   0.0005 0.0228
#> Distressed Securities   0.0011          0.0047          0.0089   0.0003 0.0181
#> Emerging Markets        0.0019          0.0030          0.0105   0.0011 0.0327
#> Equity Market Neutral   0.0005          0.0034          0.0053   0.0001 0.0082
#> Event Driven            0.0011          0.0045          0.0089   0.0004 0.0191
#> Fixed Income Arbitrage  0.0007          0.0031          0.0057   0.0001 0.0115
#> Global Macro            0.0009          0.0039          0.0073   0.0002 0.0146
#> Long/Short Equity       0.0012          0.0043          0.0091   0.0004 0.0209
#> Merger Arbitrage        0.0007          0.0043          0.0069   0.0001 0.0115
#> Relative Value          0.0007          0.0044          0.0071   0.0001 0.0119
#> Short Selling           0.0027         -0.0065          0.0040   0.0021 0.0455
#> Funds of Funds          0.0009          0.0027          0.0064   0.0003 0.0161
#>                        Skewness Kurtosis
#> Convertible Arbitrage   -2.5970  18.6011
#> CTA Global               0.1628  -0.0076
#> Distressed Securities   -1.7283   7.7946
#> Emerging Markets        -1.2205   6.0126
#> Equity Market Neutral   -1.9173  12.4266
#> Event Driven            -1.8806  10.2736
#> Fixed Income Arbitrage  -3.7918  25.4966
#> Global Macro             0.8826   2.4863
#> Long/Short Equity       -0.4702   1.9028
#> Merger Arbitrage        -1.6216  12.7706
#> Relative Value          -2.0781  10.1597
#> Short Selling            0.7737   3.6282
#> Funds of Funds          -0.5969   4.3957

result=t(table.Stats(edhec))

 # don't test on CRAN, since it requires Suggested packages

require("Hmisc")
textplot(format.df(result, na.blank=TRUE, numeric.dollar=FALSE, cdec=c(rep(1,2),rep(3,14))),
         rmar = 0.8, cmar = 1.5,  max.cex=.9, halign = "center", valign = "top",
         row.valign="center", wrap.rownames=10, wrap.colnames=10, mar = c(0,0,3,0)+0.1)
title(main="Statistics for EDHEC Indexes")