Quantile-based Summary Statistics for Location, Scale and Shape
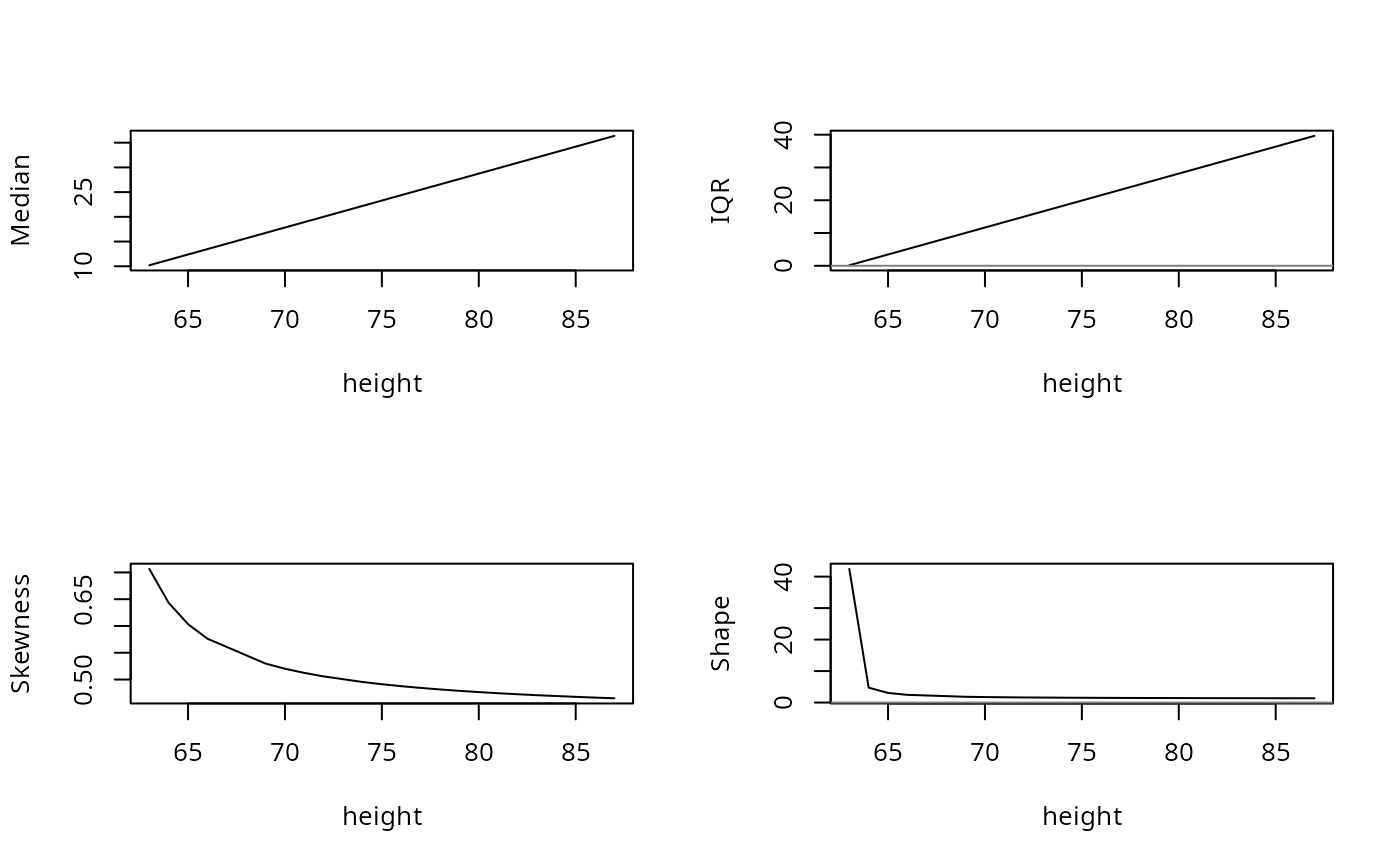
plot.qlss.RdThis function plots location, scale and shape of a conditional distribution.
Usage
# S3 method for class 'qlss'
plot(x, z, whichp = NULL, interval = FALSE, type = "l", ...)
Arguments
- x
an object of class
qlssas returned byqlss.formula.- z
numeric vector of values against which LSS measures are plotted. This argument is required.
- whichp
when
probsinqlssis a vector, the argumentwhichpspecifies one of the probabilities (and one only) inprobsthat should be used for plotting. Ifwhichp = NULL(default), the first value inprobsis used.- interval
logical flag. If
TRUE, confidence intervals for the predictions are plotted.- type
1-character string giving the type of plot desired. See
plot.default.- ...
other arguments for
plot.default.
Details
This function plots a qlss object from qlss or predict.qlss.