Hexbin Plot Matrices
hexplom.Rdhexplom draws Conditional Hexbin Plot Matrices. It is similar
to splom, expect that the default display is different.
Specifically, the default display is created using
panel.hexplom, which is an alias for panel.hexbinplot.
Usage
hexplom(x, data, ...)

# S3 method for class 'formula'
hexplom(x, data = NULL, ...)

# S3 method for class 'data.frame'
hexplom(x, data = NULL, ..., groups = NULL,
   subset = TRUE)

# S3 method for class 'matrix'
hexplom(x, data = NULL, ..., groups = NULL, subset = TRUE)

panel.hexplom(...)
Arguments
- x
The object on which method dispatch is carried out.
For the
"formula"method, a formula describing the structure of the plot, which should be of the form~ x | g1 * g2 * ..., wherexis a data frame or matrix. Each ofg1, g2, ...must be either factors or shingles. The conditioning variablesg1, g2, ...may be omitted.For the
data.frameandmatrixmethods, a data frame or matrix as appropriate.- data
For the
formulamethod, an optional data frame in which variables in the formula (as well asgroupsandsubset, if any) are to be evaluated. By default, the environment where the function was called from is used.- groups, subset, ...
see
splom. The non-standard evaluation ofgroupsandsubsetonly applies in theformulamethod. Apart from arguments that apply tosplom(many of which are only documented inxyplot), additional arguments meant forpanel.hexplom(which is an alias forpanel.hexbinplot) may also be supplied. Such arguments may include ones that control details of the hexbin calculations, documented ingplot.hexbin
Value
An object of class "trellis". The
update method can be used to
update components of the object and the
print method (usually called by
default) will plot it on an appropriate plotting device.
Author
Deepayan Sarkar [email protected], Nicholas Lewin-Koh [email protected]
Examples
## Simple hexplom
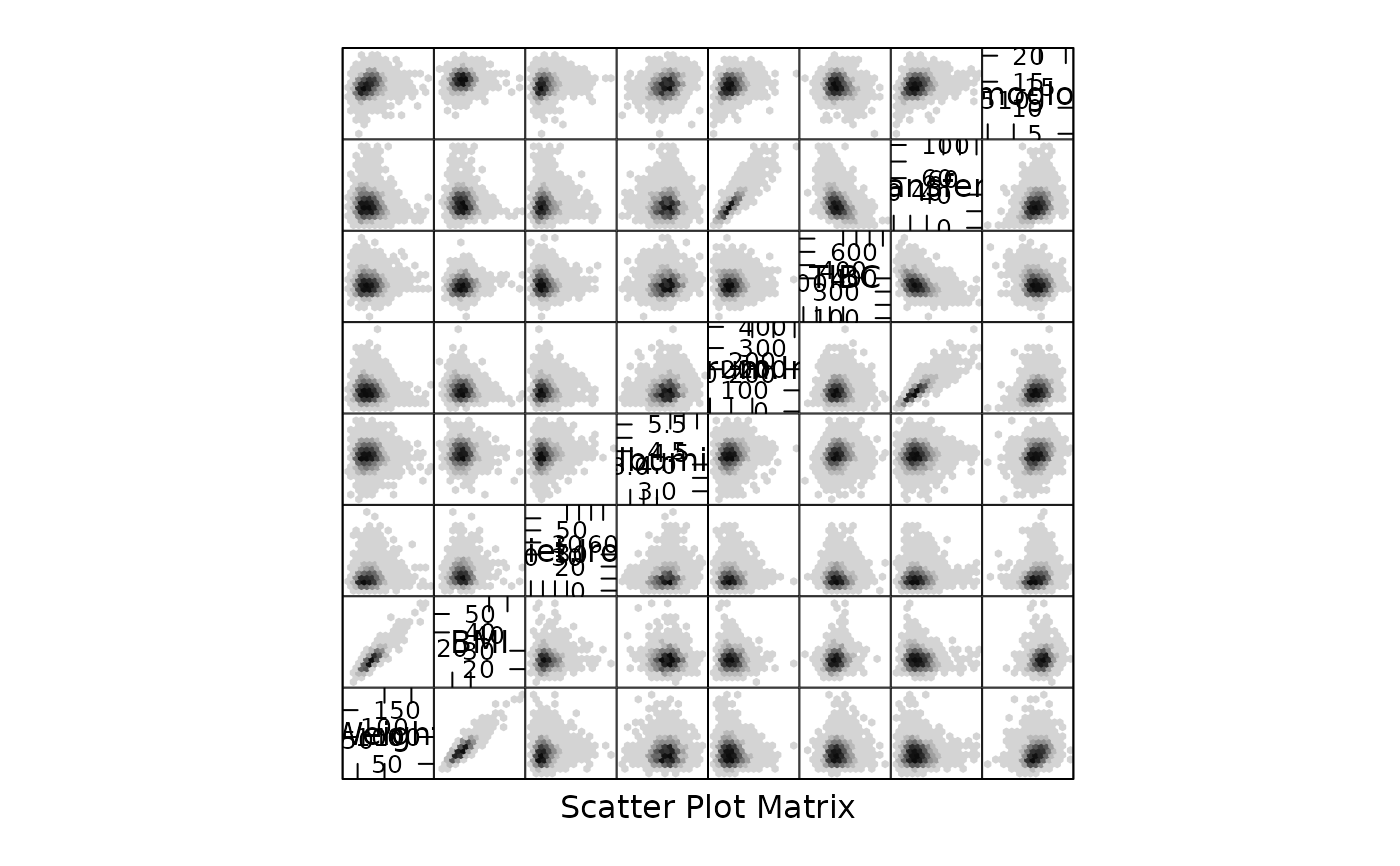
data(NHANES)
hexplom(~NHANES[,7:14], xbins=15)
 ## With colors and conditioning
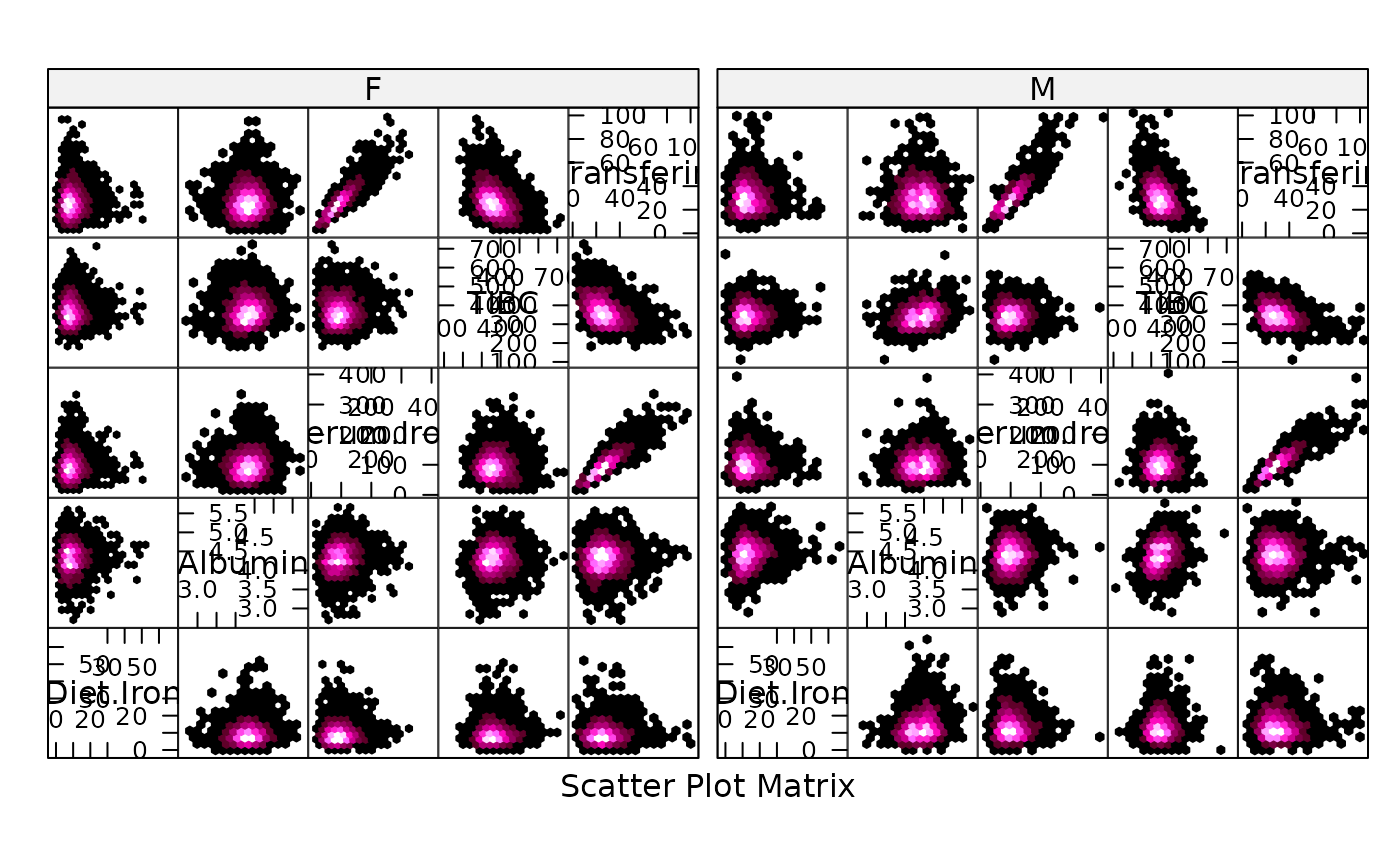
hexplom(~NHANES[,9:13] | Sex, data = NHANES,
xbins = 15, colramp = magent)
## With colors and conditioning
hexplom(~NHANES[,9:13] | Sex, data = NHANES,
xbins = 15, colramp = magent)
 ## With custom panel function
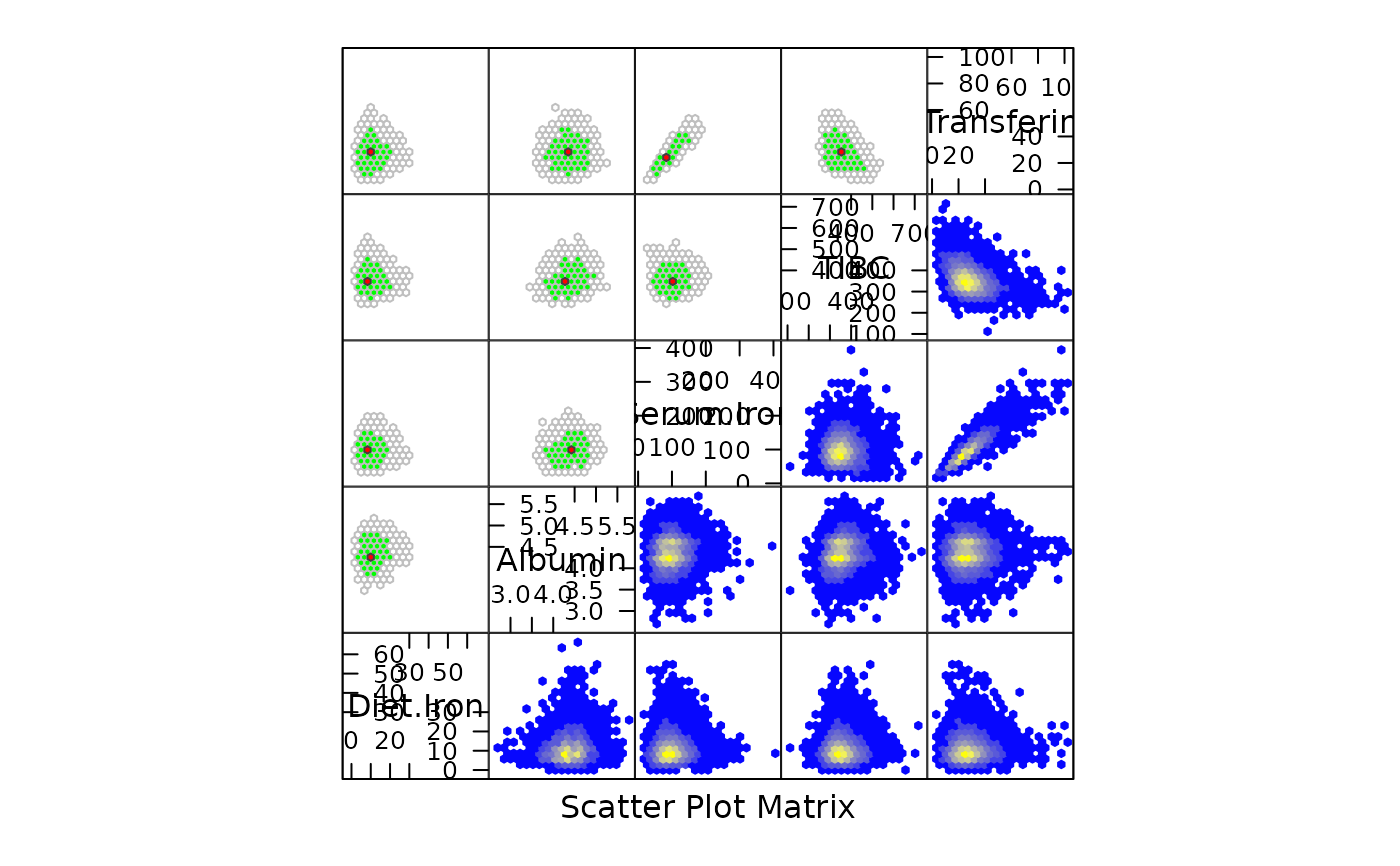
hexplom(NHANES[,9:13], xbins = 20,colramp = BTY,
upper.panel = panel.hexboxplot)
## With custom panel function
hexplom(NHANES[,9:13], xbins = 20,colramp = BTY,
upper.panel = panel.hexboxplot)