Bilinear Interpolation for Data on a Rectangular grid
bilinear.grid.RdThis is an implementation of a bilinear interpolating function.
For a point (x0,y0) contained in a rectangle (x1,y1),(x2,y1), (x2,y2),(x1,y2) and x1<x2, y1<y2, the first step is to get z() at locations (x0,y1) and (x0,y2) as convex linear combinations z(x0,y*)=a*z(x1,y*)+(1-a)*z(x2,y*) where a=(x2-x1)/(x0-x1) for y*=y1,y2. In a second step z(x0,y0) is calculated as convex linear combination between z(x0,y1) and z(x0,y2) as z(x0,y1)=b*z(x0,y1)+(1-b)*z(x0,y2) where b=(y2-y1)/(y0-y1).
Finally, z(x0,y0) is a convex linear combination of the z values at the corners of the containing rectangle with weights according to the distance from (x0,y0) to these corners.
The grid lines can be unevenly spaced.
Arguments
- x
a vector containing the
xcoordinates of the rectangular data grid.- y
a vector containing the
ycoordinates of the rectangular data grid.- z
a matrix containing the
z[i,j]data values for the grid points (x[i],y[j]).- xlim
vector of length 2 giving lower and upper limit for range
xcoordinates used for output grid.- ylim
vector of length 2 giving lower and upper limit for range of
ycoordinates used for output grid.- nx
output grid dimension in
xdirection.- ny
output grid dimension in
ydirection.- dx
output grid spacing in
xdirection, not used by default, overridesnxif specified.- dy
output grid spacing in
ydirection, not used by default, overridesnyif specified..
Value
This function produces a grid of interpolated points, feasible to be
used directly with image and contour:
- x
vector of
xcoordinates of the output grid.- y
vector of
ycoordinates of the output grid.- z
matrix of interpolated data for the output grid.
References
Pascal Getreuer, Linear Methods for Image Interpolation, Image Processing On Line, 2011, http://www.ipol.im/pub/art/2011/g_lmii/article.pdf
Note
This Fortran function was part of the akima package but not related to any of Akimas algorithms and under GPL. So it could be transfered into the interp package without changes.
BiLinear.grid is a C++ reimplementation, maybe this will replace the
Fortran implementation later. So its name may change in future versions, dont
rely on it currently.
Examples
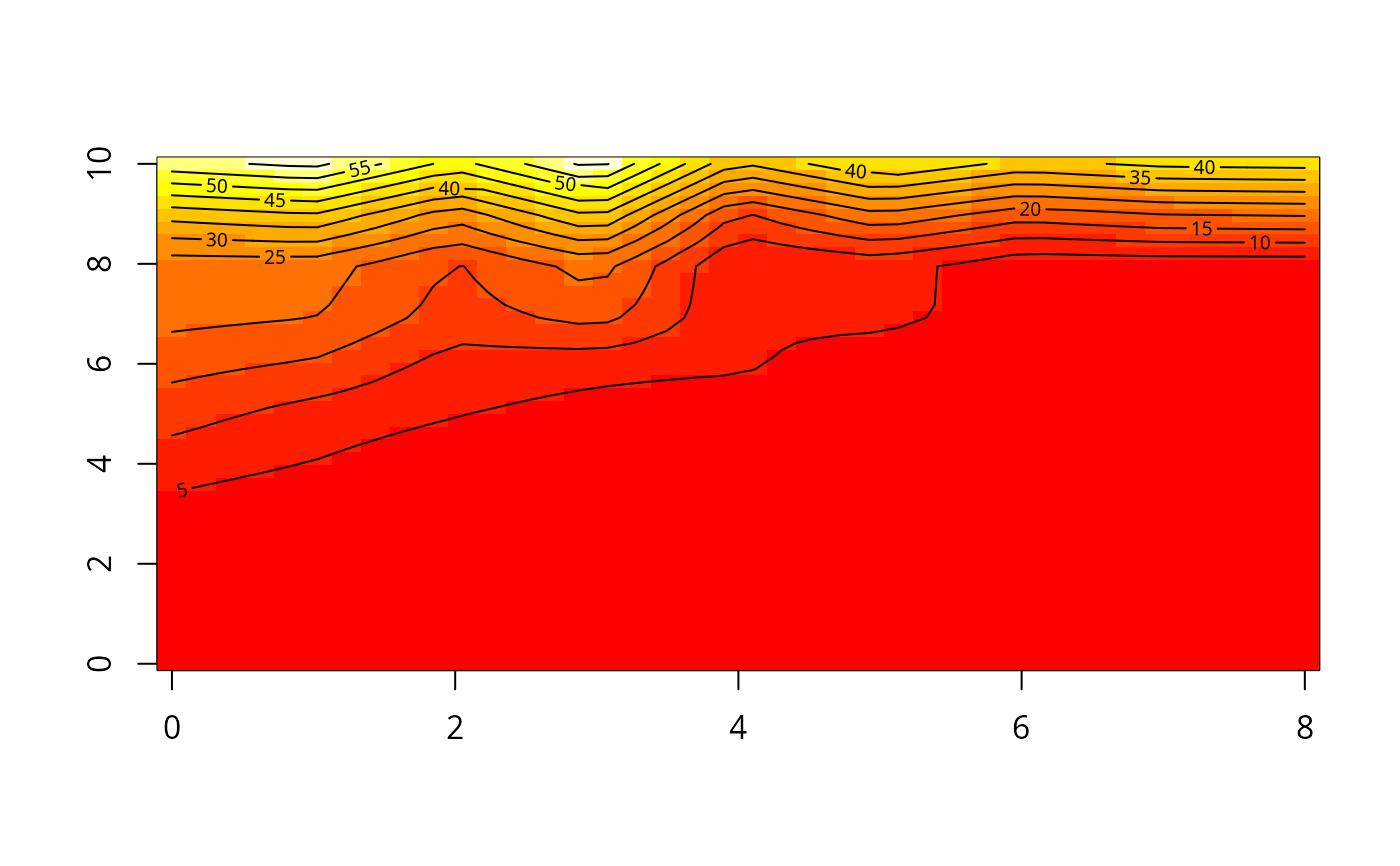
data(akima474)
# interpolate at a grid [0,8]x[0,10]
akima.bil <- bilinear.grid(akima474$x,akima474$y,akima474$z)
zmin <- min(akima.bil$z, na.rm=TRUE)
zmax <- max(akima.bil$z, na.rm=TRUE)
breaks <- pretty(c(zmin,zmax),10)
colors <- heat.colors(length(breaks)-1)
image(akima.bil, breaks=breaks, col=colors)
contour(akima.bil, levels=breaks, add=TRUE)