Draw Two-Dimensional Ellipse Based on Mean and Covariance
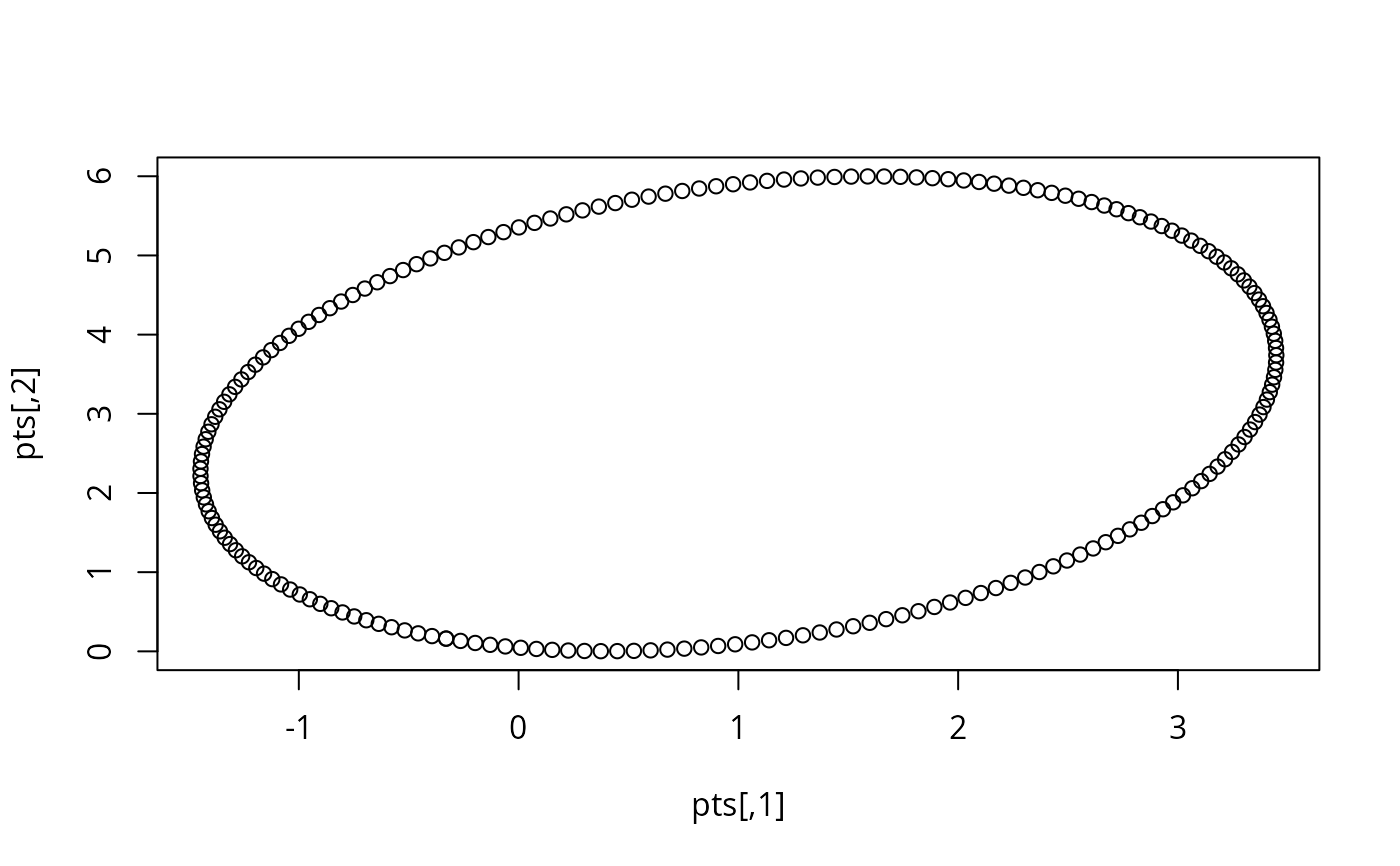
ellipse.RdDraw a two-dimensional ellipse that traces a bivariate normal density contour for a given mean vector, covariance matrix, and probability content.
Arguments
- mu
A 2-vector giving the mean.
- sigma
A 2x2 matrix giving the covariance matrix.
- alpha
Probability to be excluded from the ellipse. The default value is alpha = .05, which results in a 95% ellipse.
- npoints
Number of points comprising the border of the ellipse.
- newplot
If newplot = TRUE and draw = TRUE, plot the ellipse on a new plot. If newplot = FALSE and draw = TRUE, add the ellipse to an existing plot.
- draw
If TRUE, draw the ellipse.
- ...
Graphical parameters passed to
linesorplotcommand.
References
Johnson, R. A. and Wichern, D. W. (2002) Applied Multivariate Statistical Analysis, Fifth Edition, Prentice Hall.