Mixturegrams
mixturegram.RdConstruct a mixturegram for determining an apporpriate number of components.
Usage
mixturegram(data, pmbs, method = c("pca", "kpca", "lda"), all.n = FALSE,
      id.con = NULL, score = 1, iter.max = 50, nstart = 25, ...)
Arguments
- data
The data, which must either be a vector or a matrix. If a matrix, then the rows correspond to the observations.
- pmbs
A list of length (K-1) such that each element is an nxk matrix of the posterior membership probabilities. These are obtained from each of the "best" estimated k-component mixture models, k = 2,...,K.
- method
The dimension reduction method used.
method = "pca"implements principal components analysis.method = "kpca"implements kernel principal components analysis.method = "lda"implements reduced rank linear discriminant analysis.- all.n
A logical specifying whether the mixturegram should plot the profiles of all observations (
TRUE) or just the K-profile summaries (FALSE). The default isFALSE.- id.con
An argument that allows one to impose some sort of (meaningful) identifiability constraint so that the mixture components are in some sort of comparable order between mixture models with different numbers of components. If
NULL, then the components are ordered by the component means for univariate data or ordered by the first dimension of the component means for multivariate data.- score
The value for the specified dimension reduction technique's score, which is used for constructing the mixturegram. By default, this value is
1, which is the value that will typically be used. Larger values will result in more variability displayed on the mixturegram. Note that the largest value that can be calculated at each value of k>1 on the mixturegram is p+k-1, where p is the number of columns ofdata.- iter.max
The maximum number of iterations allowed for the k-means clustering algorithm, which is passed to the
kmeansfunction. The default is50.- nstart
The number of random sets chosen based on k centers, which is passed to the
kmeansfunction. The default is25.- ...
Additional arguments that can be passed to the underlying
plotfunction.
Value
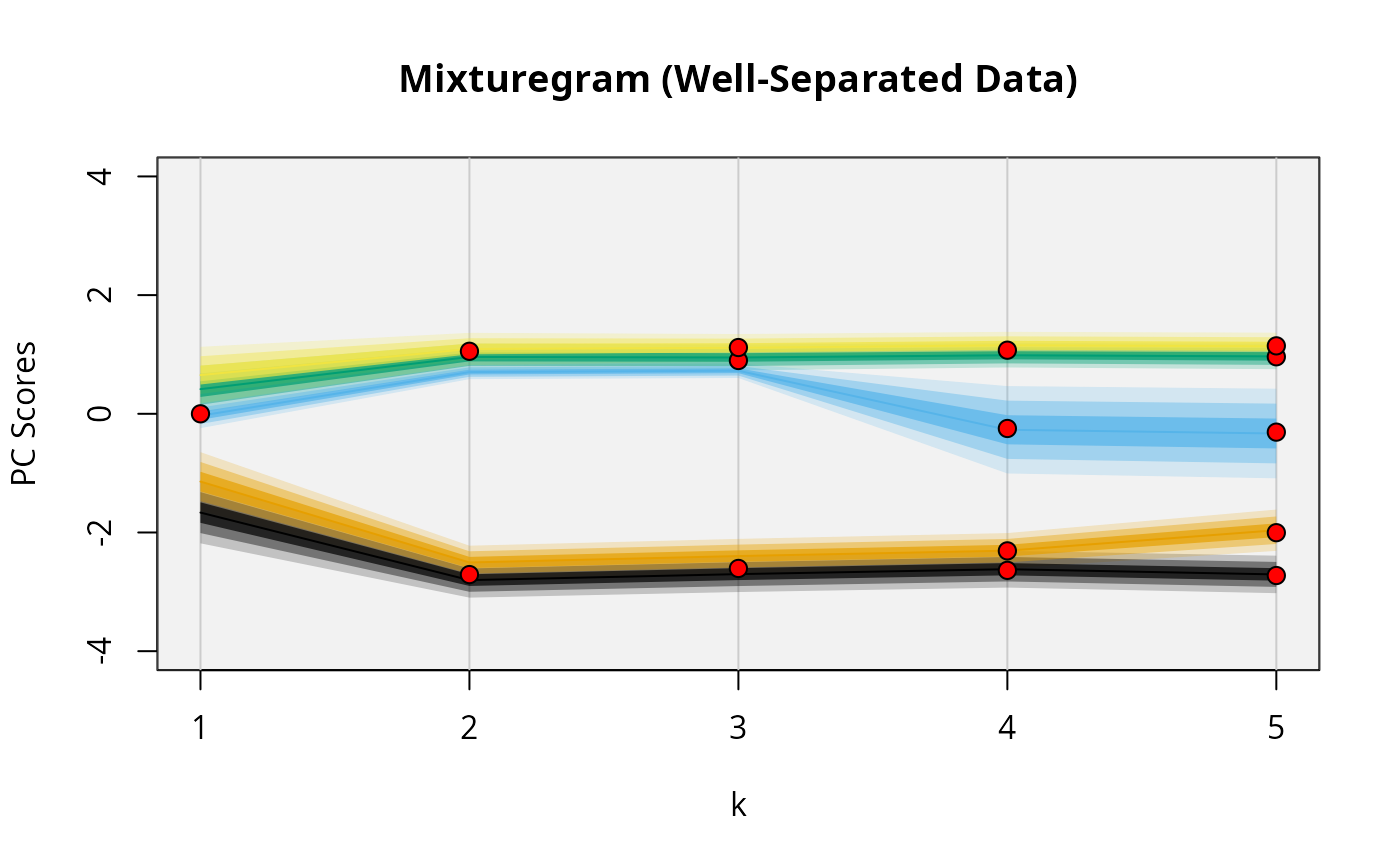
mixturegram returns a mixturegram where the profiles are plotted over component values of k = 1,...,K.
References
Young, D. S., Ke, C., and Zeng, X. (2018) The Mixturegram: A Visualization Tool for Assessing the Number of Components in Finite Mixture Models, Journal of Computational and Graphical Statistics, 27(3), 564–575.
Examples
##Data generated from a 2-component mixture of normals.
set.seed(100)
n <- 100
w <- rmultinom(n,1,c(.3,.7))
y <- sapply(1:n,function(i) w[1,i]*rnorm(1,-6,1) +
w[2,i]*rnorm(1,0,1))
selection <- function(i,data,rep=30){
out <- replicate(rep,normalmixEM(data,epsilon=1e-06,
k=i,maxit=5000),simplify=FALSE)
counts <- lapply(1:rep,function(j)
table(apply(out[[j]]$posterior,1,
which.max)))
counts.length <- sapply(counts, length)
counts.min <- sapply(counts, min)
counts.test <- (counts.length != i)|(counts.min < 5)
if(sum(counts.test) > 0 & sum(counts.test) < rep)
out <- out[!counts.test]
l <- unlist(lapply(out, function(x) x$loglik))
tmp <- out[[which.max(l)]]
}
all.out <- lapply(2:5, selection, data = y, rep = 2)
#> number of iterations= 7
#> number of iterations= 7
#> number of iterations= 52
#> number of iterations= 88
#> number of iterations= 266
#> number of iterations= 111
#> number of iterations= 262
#> number of iterations= 69
pmbs <- lapply(1:length(all.out), function(i)
all.out[[i]]$post)
mixturegram(y, pmbs, method = "pca", all.n = FALSE,
id.con = NULL, score = 1,
main = "Mixturegram (Well-Separated Data)")
 #> $stopping
#> [1] 1.000000000 0.012826548 0.005056038 0.004510841 0.003132543
#>
#> $stopping
#> [1] 1.000000000 0.012826548 0.005056038 0.004510841 0.003132543
#>