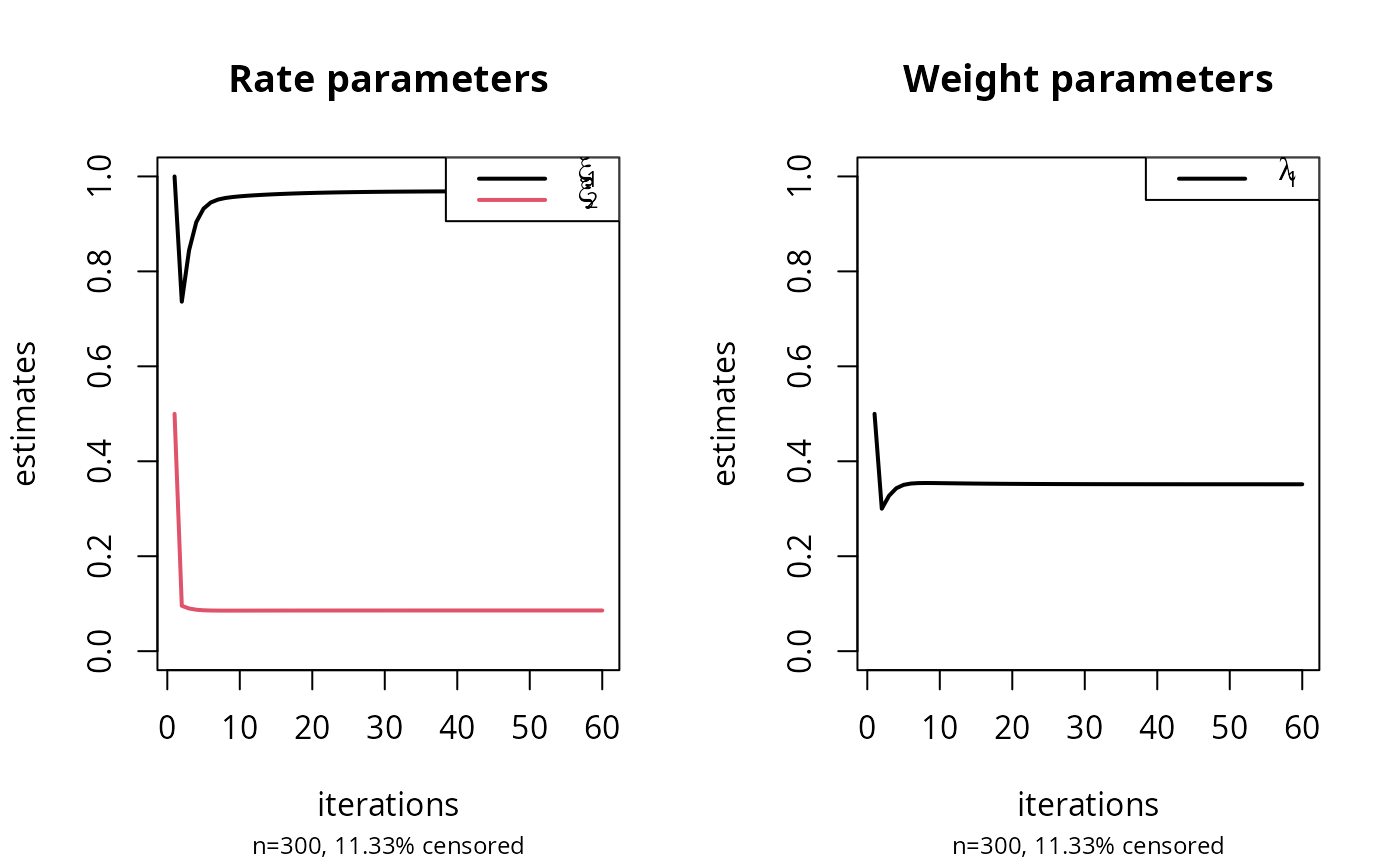
Plot sequences from the EM algorithm for censored mixture of exponentials
plotexpRMM.RdFunction for plotting sequences of estimates along iterations, from an object returned by the expRMM_EM, an EM algorithm for mixture of exponential
distributions with randomly right censored data (see reference below).
Arguments
- a
An object returned by
expRMM_EM.- title
The title of the plot, set to some default value if
NULL.- rowstyle
Window organization, for plots in rows (the default) or columns.
- subtitle
A subtitle for the plot, set to some default value if
NULL.- ...
Other parameters (such as
lwd) passed toplot,lines, andlegendcommands.
See also
Related functions:
expRMM_EM, summary.mixEM, plot.mixEM.
Other models and algorithms for censored lifetime data
(name convention is model_algorithm):
weibullRMM_SEM, spRMM_SEM.
References
Bordes, L., and Chauveau, D. (2016), Stochastic EM algorithms for parametric and semiparametric mixture models for right-censored lifetime data, Computational Statistics, Volume 31, Issue 4, pages 1513-1538. https://link.springer.com/article/10.1007/s00180-016-0661-7
Examples
n=300 # sample size
m=2   # number of mixture components
lambda <- c(1/3,1-1/3); rate <- c(1,1/10) # mixture parameters
set.seed(1234)
x <- rexpmix(n, lambda, rate) # iid ~ exponential mixture
cs=runif(n,0,max(x)) # Censoring (uniform) and incomplete data
t <- apply(cbind(x,cs),1,min) # observed or censored data
d <- 1*(x <= cs)              # censoring indicator

###### EM for RMM, exponential lifetimes
l0 <- rep(1/m,m); r0 <- c(1, 0.5) # "arbitrary" initial values
a <- expRMM_EM(t, d, lambda=l0, rate=r0, k = m)
#> number of iterations = 59
summary(a)             # EM estimates etc
#> summary of expRMM_EM object:
#>          comp 1    comp 2
#> lambda 0.351555 0.6484450
#> rate   0.969003 0.0857216
#> loglik at estimate:  -762.4311
#> 11.33333 % of the data right censored
plotexpRMM(a, lwd=2) # plot of EM sequences