Convert a data frame or a matrix into an xtabs object.
Usage
as.xtabs(x, ...)

# S3 method for class 'data.frame'
as.xtabs(x, rowvar = NULL, colvar = NULL, labels = 1, ...)

# S3 method for class 'matrix'
as.xtabs(x, rowvar = NULL, colvar = NULL, ...)
Arguments
- x
object (typically a data frame) to be converted to
xtabsformat- ...
additional arguments to be passed to or from methods.
- rowvar
name of the row variable as character string
- colvar
name of the column variable as character string
- labels
column of data frame that contains the labels of the row variable.
Details
The intended use is to convert a two-way contingency table stored in a data
frame or a matrix into an xtabs object.
Examples
# example from example(fisher.test)
df <- data.frame( X=c('Tea','Milk'), Tea=c(3,1), Milk=c(1,3) )
xt <- as.xtabs(df, rowvar="Guess", colvar="Truth"); xt
#>       Truth
#> Guess  Tea Milk
#>   Tea    3    1
#>   Milk   1    3
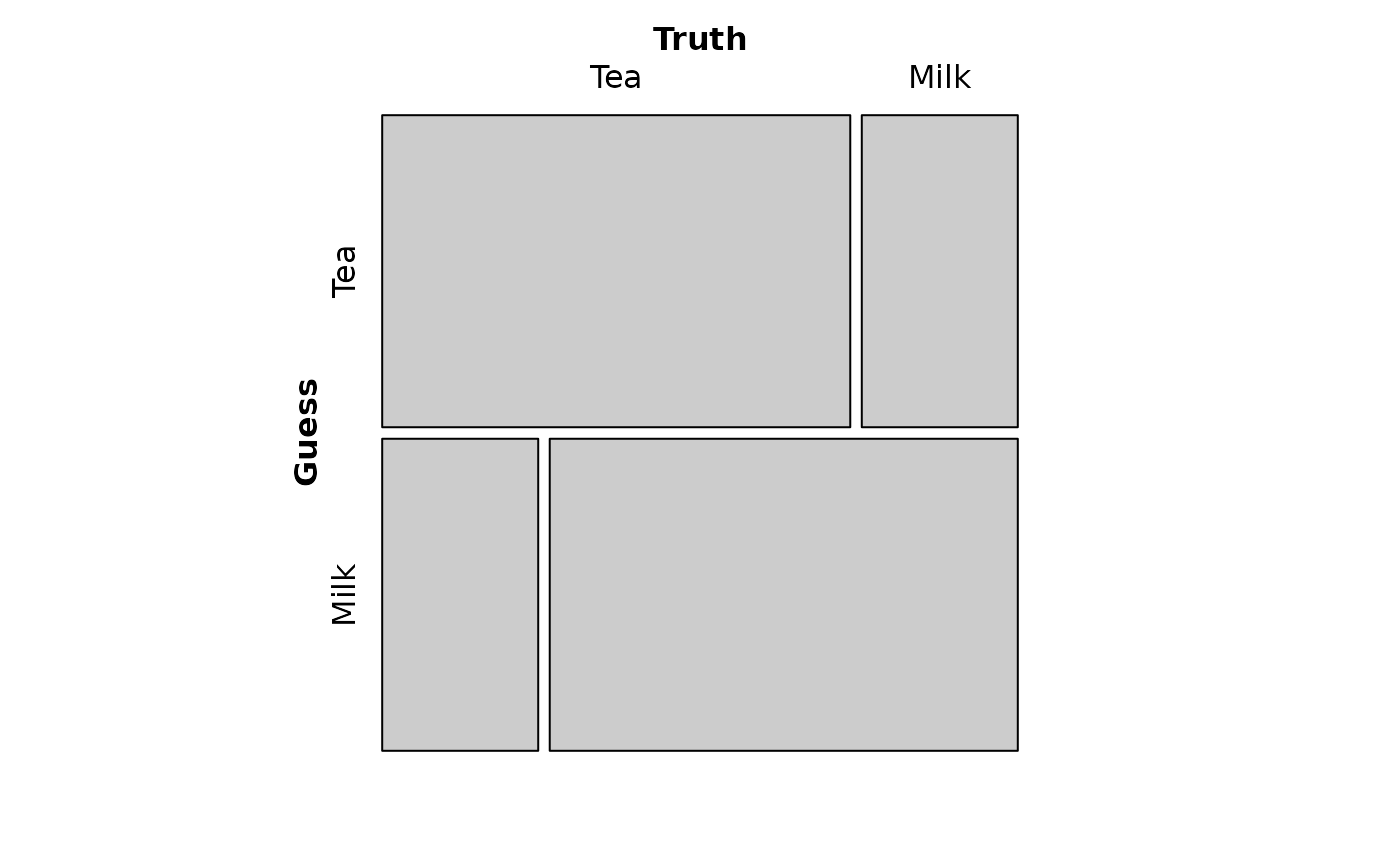
if (require(vcd)) { mosaic(xt) }
#> Loading required package: vcd
#> Loading required package: grid
#>
#> Attaching package: ‘vcd’
#> The following object is masked from ‘package:mosaic’:
#>
#>     mplot