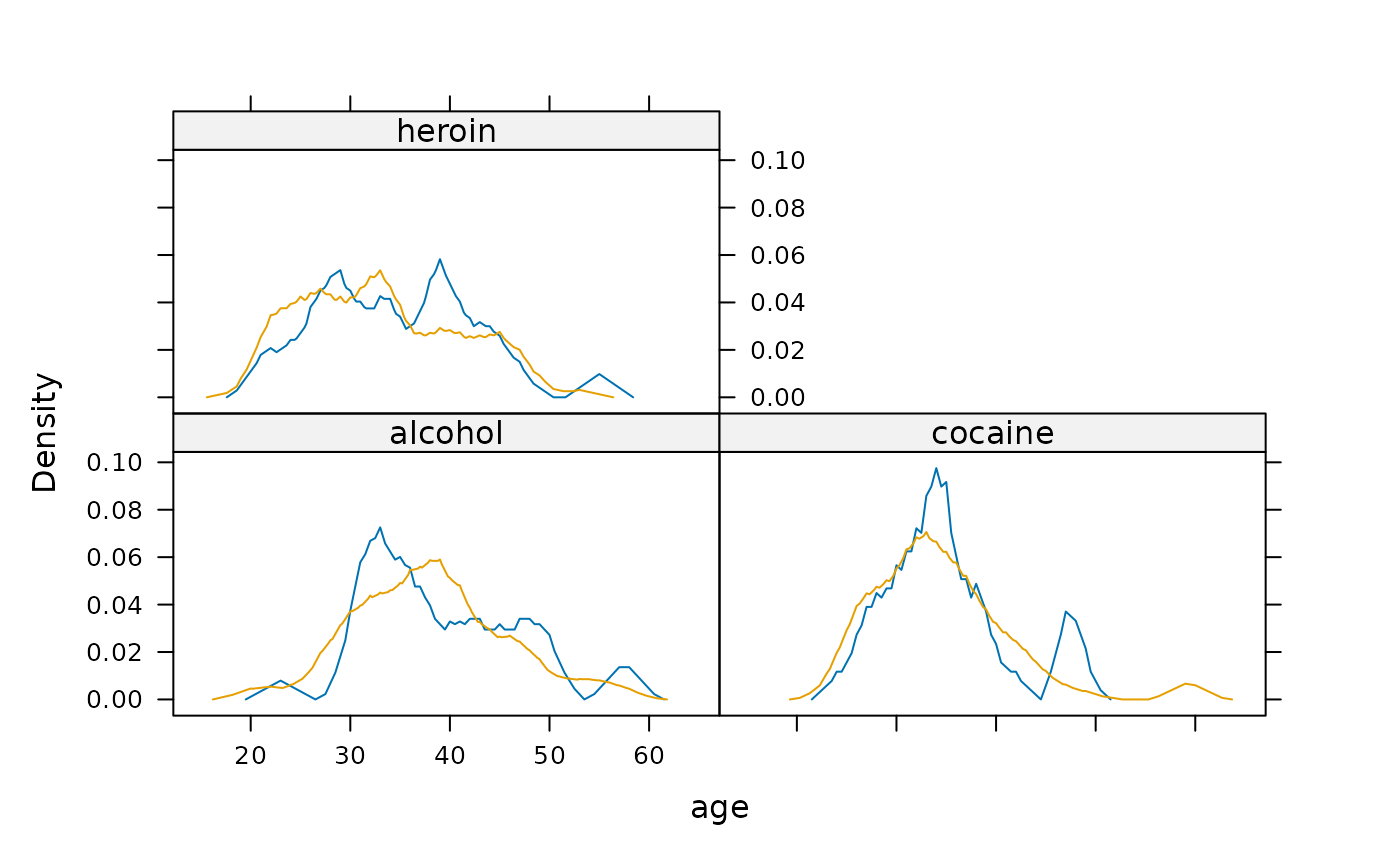
An ASH plot is the average over all histograms of a fixed bin width.
Usage
ashplot(
  x,
  data = data,
  ...,
  width = NULL,
  adjust = NULL,
  panel = panel.ashplot,
  prepanel = prepanel.default.ashplot
)

prepanel.default.ashplot(x, darg, groups = NULL, subscripts = TRUE, ...)

panel.ashplot(
  x,
  darg = list(),
  plot.points = FALSE,
  ref = FALSE,
  groups = NULL,
  jitter.amount = 0.01 * diff(current.panel.limits()$ylim),
  type = "p",
  ...,
  identifier = "ash"
)
Arguments
- x
A formula or numeric vector.
- data
A data frame.
- ...
Additional arguments passed to panel and prepanel functions or
data, a data frame in which to find the variables used for the plot.- width
The histogram bin width.
- adjust
A numeric adjustment to
width. Primarily useful whenwidthis not specified. Increasingadjustmakes the plot smoother.- panel
A panel function.
- prepanel
A prepanel function.
- darg
a list of arguments for the function computing the ASH.
- groups
as in other lattice plots
- subscripts
as in other lattice prepanel functions
- plot.points
One of
TRUE,FALSE,"jitter", or"rug"- ref
a logical indicating whether a reference line should be displayed
- jitter.amount
when
plot.points="jitter", the value to use as the amount argument tojitter().- type
type argument used to plot points, if requested. This is not expected to be useful, it is available mostly to protect a
typeargument, if specified, from affecting the display of the ASH.- identifier
A character string that is prepended to the names of i grobs that are created by this panel function.