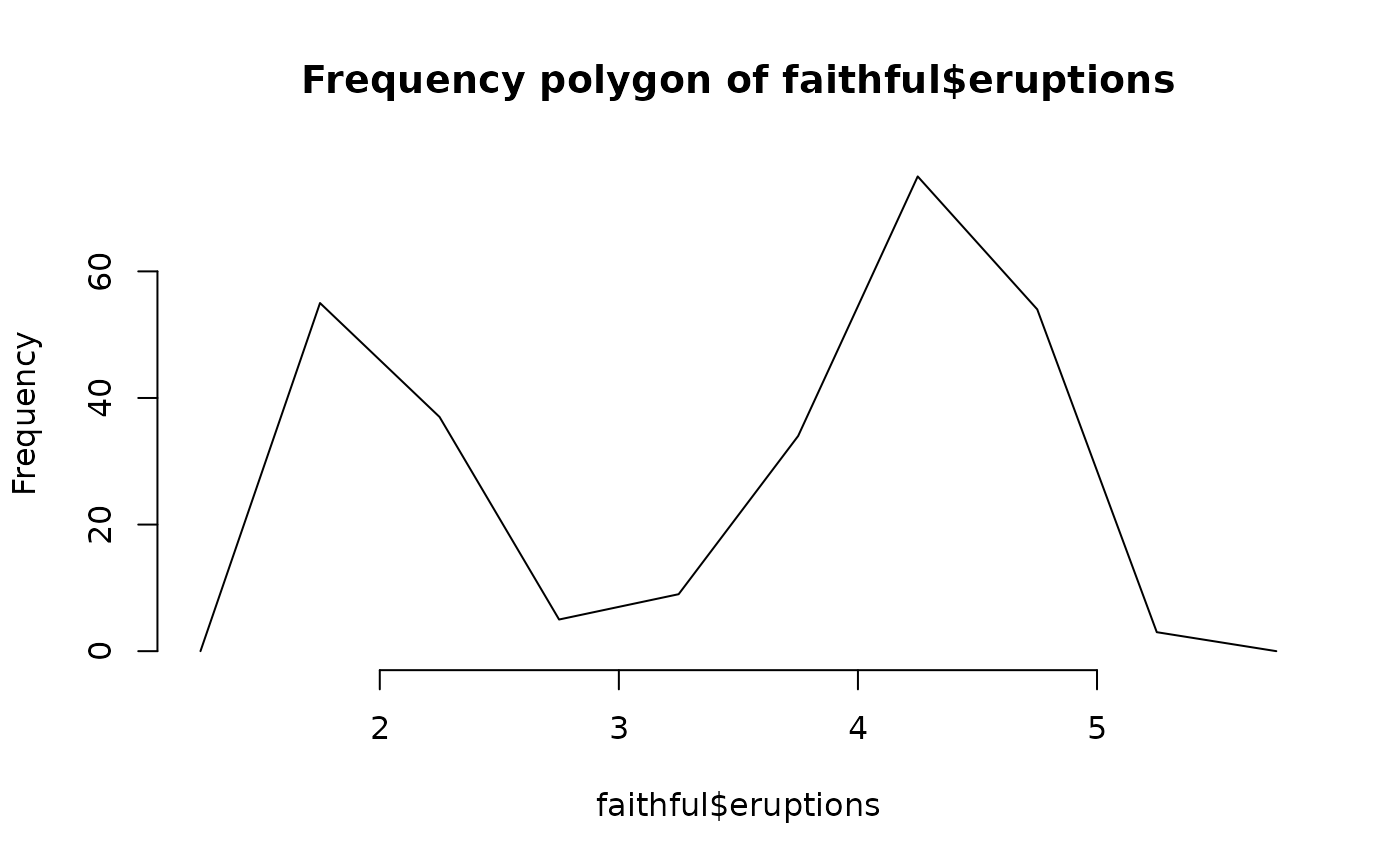
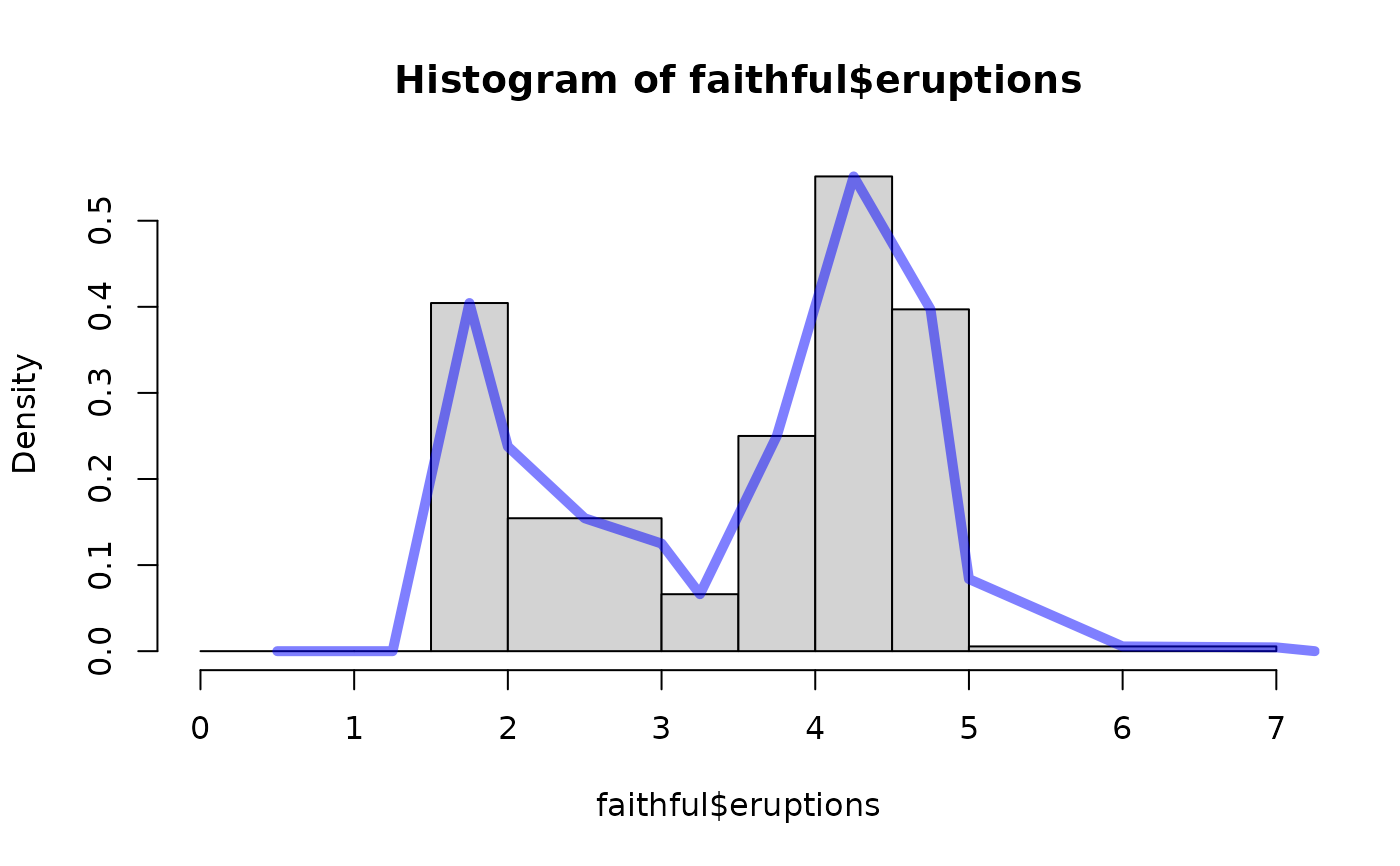
Turn histograms into frequency polygons
Usage
freqpoly(x, plot = TRUE, ...)

hist2freqpolygon(hist)

# S3 method for class 'freqpolygon'
plot(
  x,
  freq = equidist,
  col = graphics::par("fg"),
  lty = NULL,
  lwd = 1,
  main = paste("Frequency polygon of", paste(x$xname, collapse = "\n")),
  sub = NULL,
  xlab = x$xname,
  ylab,
  xlim = range(x$x),
  ylim = NULL,
  axes = TRUE,
  labels = FALSE,
  add = FALSE,
  ann = TRUE,
  ...
)
Arguments
- x
a vector of values for which a frequency polygon is desired.
- plot
a logical indicating if a plot should be generated.
- ...
additional arguments passed on to
hist().- hist
a histogram object produced by
link{hist}().- freq
A logical indicating whether the vertical scale should be frequency (count).
- col
A color for the frequency polygon.
- lty
An integer indicating the line type.
- lwd
An integer indicating the line width.
- main
A title for the plot.
- sub
A sub-title for the plot.
- xlab
Label for the horizontal axis.
- ylab
Label for the vertical axis.
- xlim
A numeric vector of length 2.
- ylim
A numeric vector of length 2.
- axes
A logical indicating whether axes should be drawn.
- labels
A logical indicating whether labels should be printed or a character vector of labels to add.
- add
A logical indicating whether the plot should be added to the current plot
- ann
A logical indicating whether annotations (titles and axis titles) should be plotted.