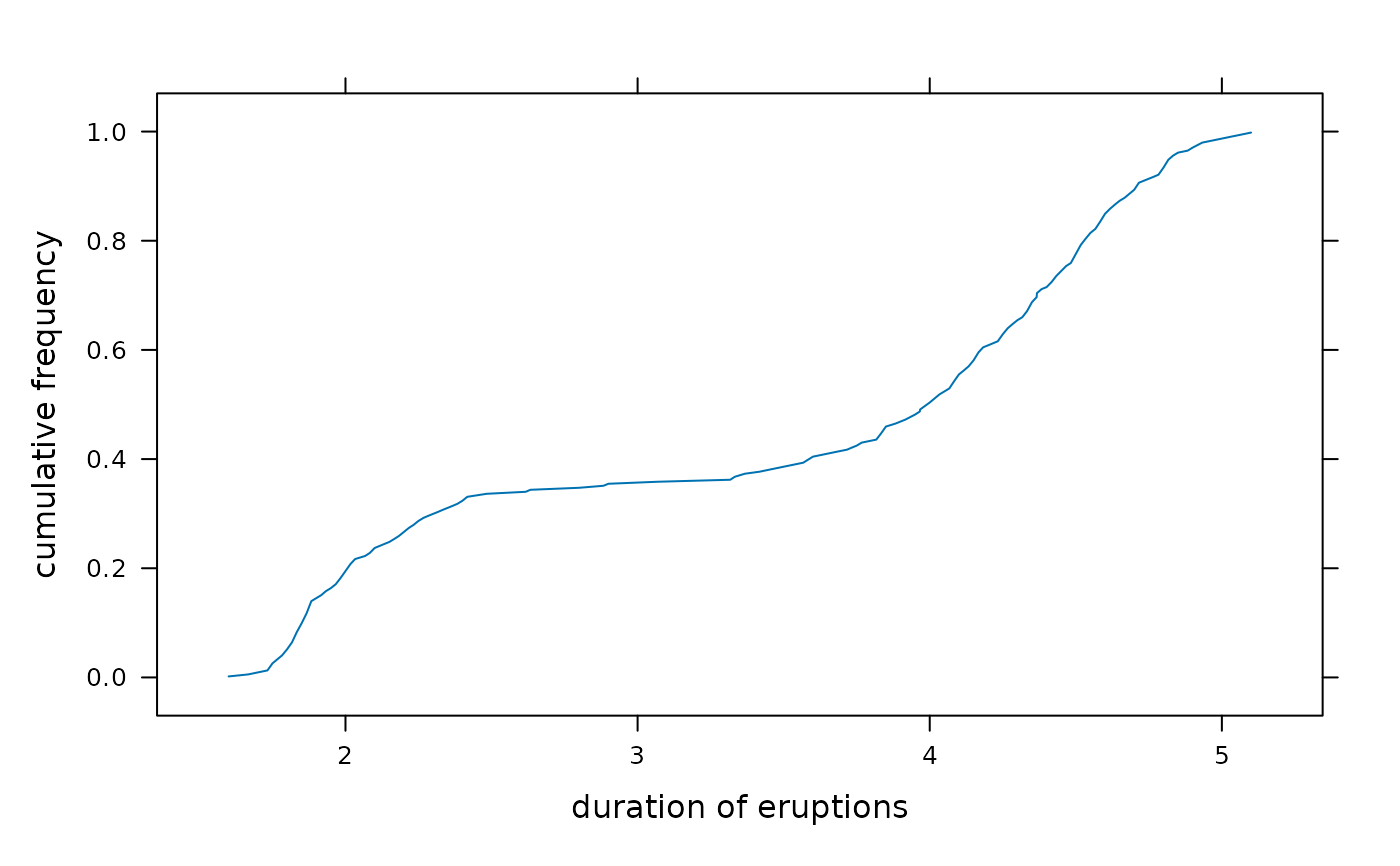
A high-level function for producing a cumulative frequency plot using
lattice graphics.
Usage
plotCumfreq(x, data, ...)

# S3 method for class 'formula'
plotCumfreq(x, data = NULL, subscripts, ...)

# Default S3 method
plotCumfreq(x, ...)

prepanel.cumfreq(x, ...)

panel.cumfreq(x, type = c("smooth", "step"), groups = NULL, ...)
Arguments
- x
a formula or numeric vector
- data
a data frame in which x is evaluated if x is a
formula.
- ...
other lattice arguments
- subscripts
as in lattice plots
- type
smooth or step-function?
- groups
grouping variable
Value
A plot of the empirical cumulative distribution function for sample values specified in x.
Examples
plotCumfreq(~eruptions, faithful, xlab = 'duration of eruptions')