These functions behave similarly to the functions with the initial x
removed from their names but add more verbose output and graphics.
Usage
xpnorm(
  q,
  mean = 0,
  sd = 1,
  plot = TRUE,
  verbose = TRUE,
  invisible = FALSE,
  digits = 4,
  lower.tail = TRUE,
  log.p = FALSE,
  xlim = mean + c(-4, 4) * sd,
  ylim = c(0, 1.4 * dnorm(mean, mean, sd)),
  manipulate = FALSE,
  ...,
  return = c("value", "plot")
)

xqnorm(
  p,
  mean = 0,
  sd = 1,
  plot = TRUE,
  verbose = TRUE,
  digits = getOption("digits"),
  lower.tail = TRUE,
  log.p = FALSE,
  xlim,
  ylim,
  invisible = FALSE,
  ...,
  return = c("value", "plot"),
  pattern = c("stripes", "rings")
)

xcnorm(
  p,
  mean = 0,
  sd = 1,
  plot = TRUE,
  verbose = TRUE,
  digits = getOption("digits"),
  lower.tail = TRUE,
  log.p = FALSE,
  xlim,
  ylim,
  invisible = FALSE,
  ...,
  return = c("value", "plot"),
  pattern = "rings"
)
Arguments
- q
quantile
- mean, sd
parameters of normal distribution.
- plot
logical. If TRUE, show an illustrative plot.
- verbose
logical. If TRUE, display verbose output.
- invisible
logical. If TRUE, return value invisibly.
- digits
number of digits to display in output.
- lower.tail
logical. If FALSE, use upper tail probabilities.
- log.p
logical. If TRUE, uses the log of probabilities.
- xlim, ylim
limits for plotting.
- manipulate
logical. If TRUE and in RStudio, then sliders are added for interactivity.
- ...
additional arguments.
- return
If
"plot", return a plot. If"values", return a vector of numerical values.- p
probability
- pattern
One of
"stripes"or"rings". In the latter case, pairs of regions (from inside to outside) are grouped together for coloring and probability calculation.
Examples
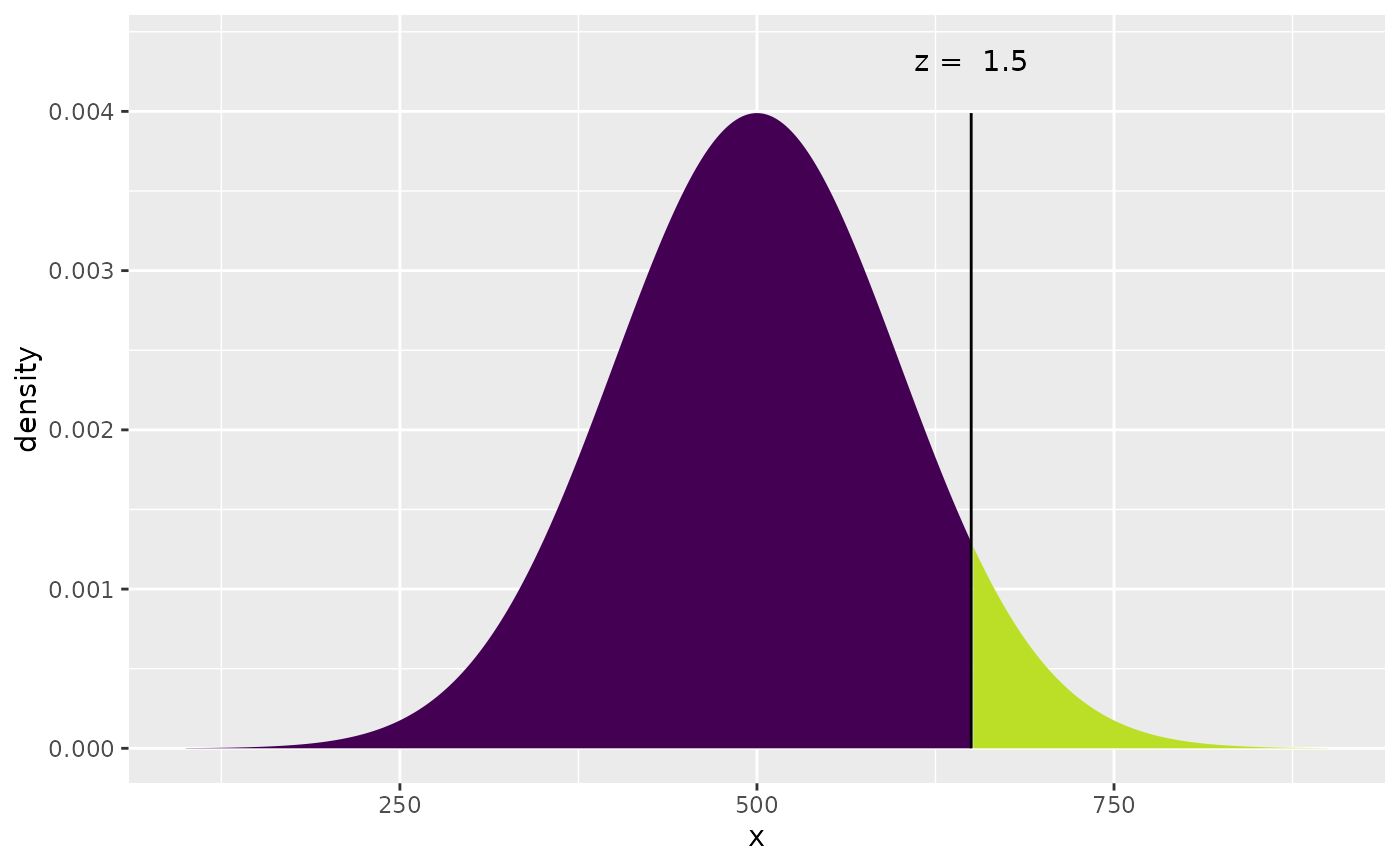
xpnorm(650, 500, 100)
#>
#> If X ~ N(500, 100), then
#> P(X <= 650) = P(Z <= 1.5) = 0.9332
#> P(X > 650) = P(Z > 1.5) = 0.06681
#>
 #> [1] 0.9331928
xqnorm(.75, 500, 100)
#>
#> If X ~ N(500, 100), then
#> P(X <= 567.449) = 0.75
#> P(X > 567.449) = 0.25
#>
#> [1] 0.9331928
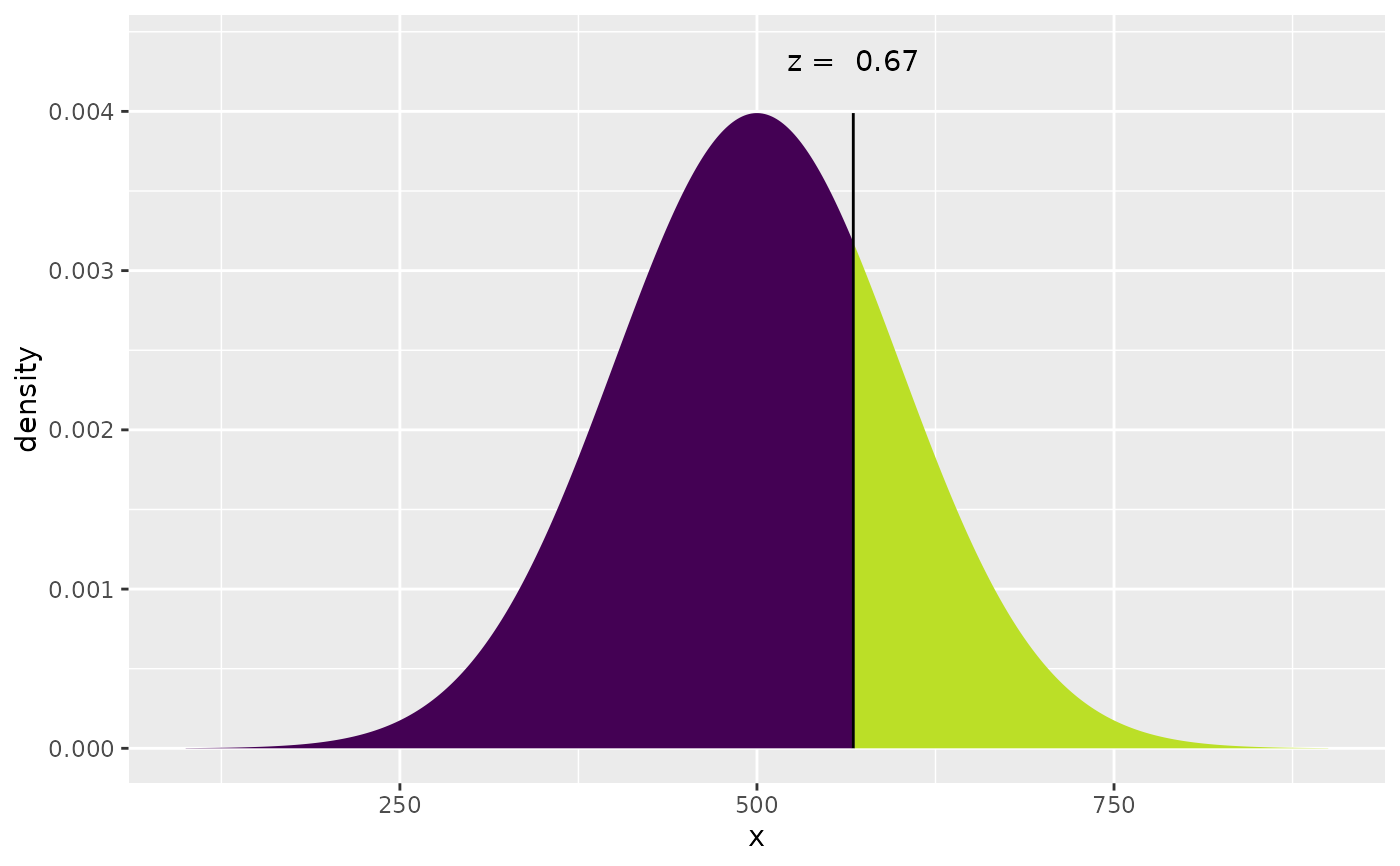
xqnorm(.75, 500, 100)
#>
#> If X ~ N(500, 100), then
#> P(X <= 567.449) = 0.75
#> P(X > 567.449) = 0.25
#>
 #> [1] 567.449
xpnorm(-3:3, return = "plot", system = "gg") |>
gf_labs(title = "My Plot", x = "") |>
gf_theme(theme_bw())
#>
#> If X ~ N(0, 1), then
#> P(X <= -3) = P(Z <= -3) = 0.00135 P(X <= -2) = P(Z <= -2) = 0.02275 P(X <= -1) = P(Z <= -1) = 0.15866 P(X <= 0) = P(Z <= 0) = 0.50000 P(X <= 1) = P(Z <= 1) = 0.84134 P(X <= 2) = P(Z <= 2) = 0.97725 P(X <= 3) = P(Z <= 3) = 0.99865
#> P(X > -3) = P(Z > -3) = 0.99865 P(X > -2) = P(Z > -2) = 0.97725 P(X > -1) = P(Z > -1) = 0.84134 P(X > 0) = P(Z > 0) = 0.50000 P(X > 1) = P(Z > 1) = 0.15866 P(X > 2) = P(Z > 2) = 0.02275 P(X > 3) = P(Z > 3) = 0.00135
#>
#> [1] 567.449
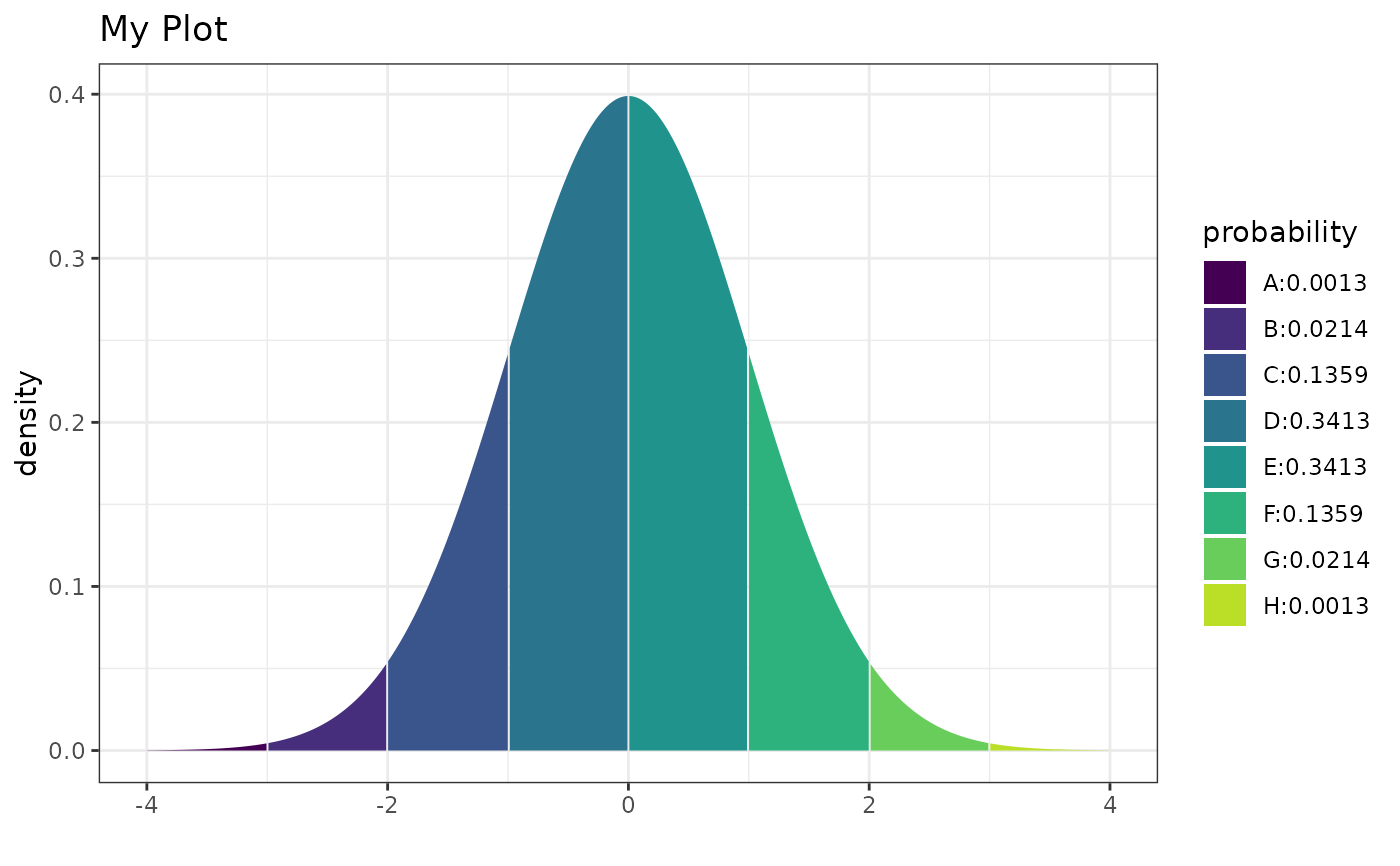
xpnorm(-3:3, return = "plot", system = "gg") |>
gf_labs(title = "My Plot", x = "") |>
gf_theme(theme_bw())
#>
#> If X ~ N(0, 1), then
#> P(X <= -3) = P(Z <= -3) = 0.00135 P(X <= -2) = P(Z <= -2) = 0.02275 P(X <= -1) = P(Z <= -1) = 0.15866 P(X <= 0) = P(Z <= 0) = 0.50000 P(X <= 1) = P(Z <= 1) = 0.84134 P(X <= 2) = P(Z <= 2) = 0.97725 P(X <= 3) = P(Z <= 3) = 0.99865
#> P(X > -3) = P(Z > -3) = 0.99865 P(X > -2) = P(Z > -2) = 0.97725 P(X > -1) = P(Z > -1) = 0.84134 P(X > 0) = P(Z > 0) = 0.50000 P(X > 1) = P(Z > 1) = 0.15866 P(X > 2) = P(Z > 2) = 0.02275 P(X > 3) = P(Z > 3) = 0.00135
#>
 if (FALSE) { # \dontrun{
if (rstudio_is_available() & require(manipulate)) {
manipulate(xpnorm(score, 500, 100, verbose = verbose),
score = slider(200, 800),
verbose = checkbox(TRUE, label = "Verbose Output")
)
}
} # }
if (FALSE) { # \dontrun{
if (rstudio_is_available() & require(manipulate)) {
manipulate(xpnorm(score, 500, 100, verbose = verbose),
score = slider(200, 800),
verbose = checkbox(TRUE, label = "Verbose Output")
)
}
} # }