Augmented version of qqmath
Usage
xqqmath(x, data = NULL, panel = "panel.xqqmath", ...)

panel.xqqmath(
  x,
  qqmathline = !(fitline || idline),
  idline = FALSE,
  fitline = NULL,
  slope = NULL,
  intercept = NULL,
  overlines = FALSE,
  groups = NULL,
  ...,
  col.line = trellis.par.get("add.line")$col,
  pch = 16,
  lwd = 2,
  lty = 2
)
Arguments
- x, data, panel, ...
as in
lattice::qqmath()- qqmathline
a logical: should line be displayed passing through first and third quartiles?
- idline
a logical; should the line y=x be added to the plot?
- fitline
a logical; should a fitted line be added to plot? Such a line will use
slopeandinterceptif provided, else the standard deviation and mean of the data. Ifslopeis specified, the line will be added unlessfitlineisFALSE.- slope
slope for added line
- intercept
intercept for added line
- overlines
a logical: should lines be on top of qq plot?
- groups, pch, lwd, lty
as in lattice plots
- col.line
color to use for added lines
Examples
x <- rnorm(100)
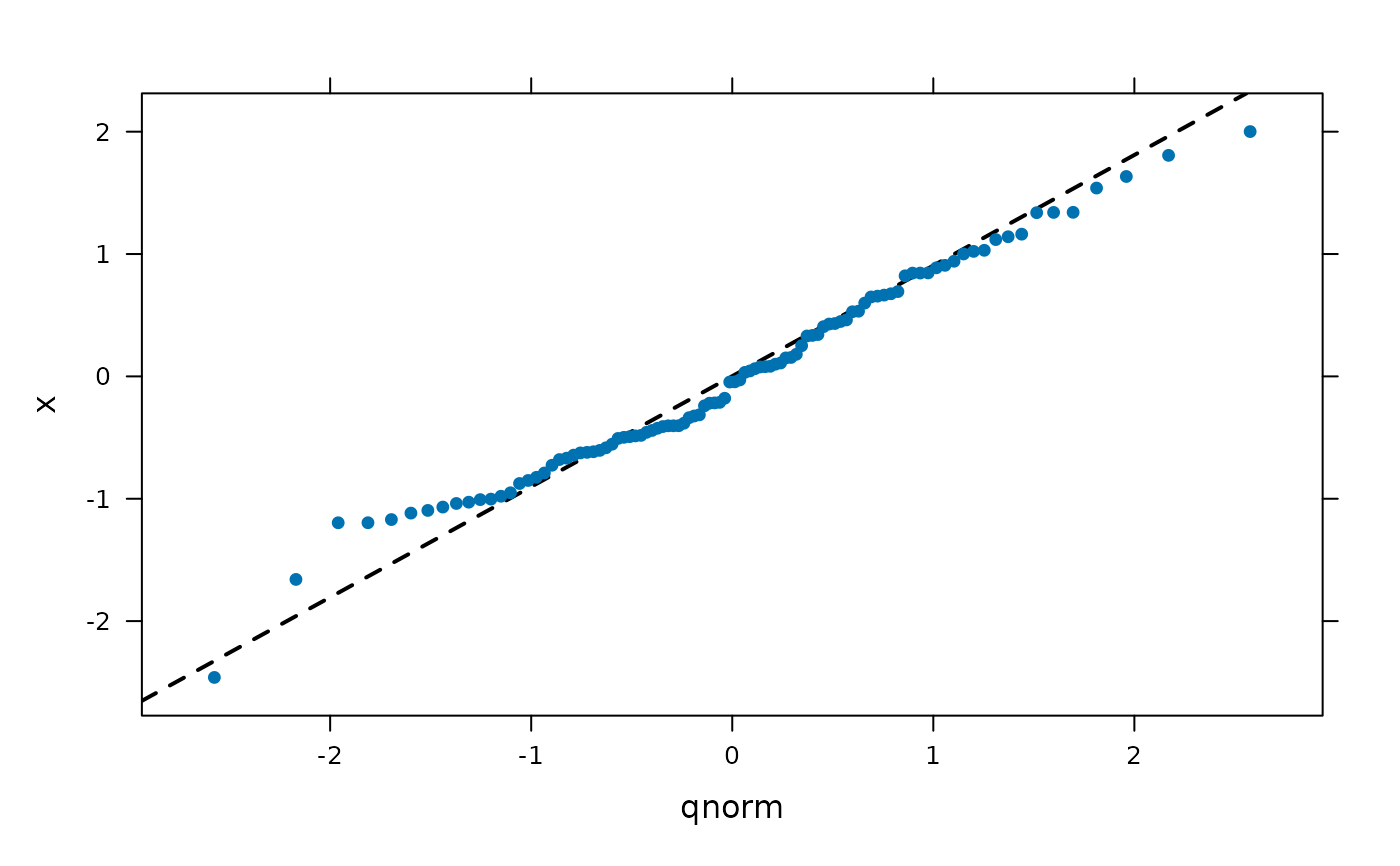
xqqmath( ~ x) # with quartile line
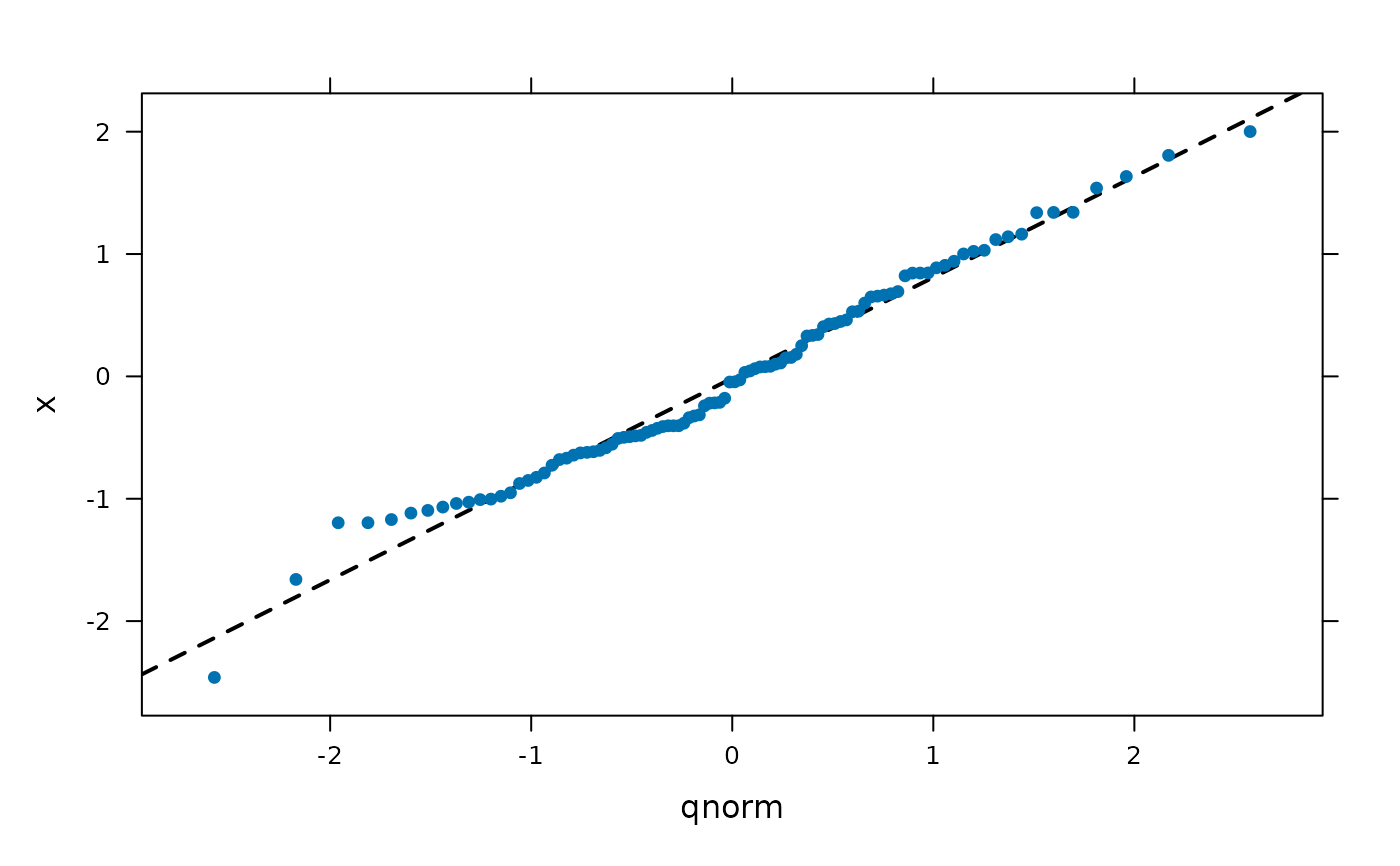
 xqqmath( ~ x, fitline = TRUE) # with fitted line
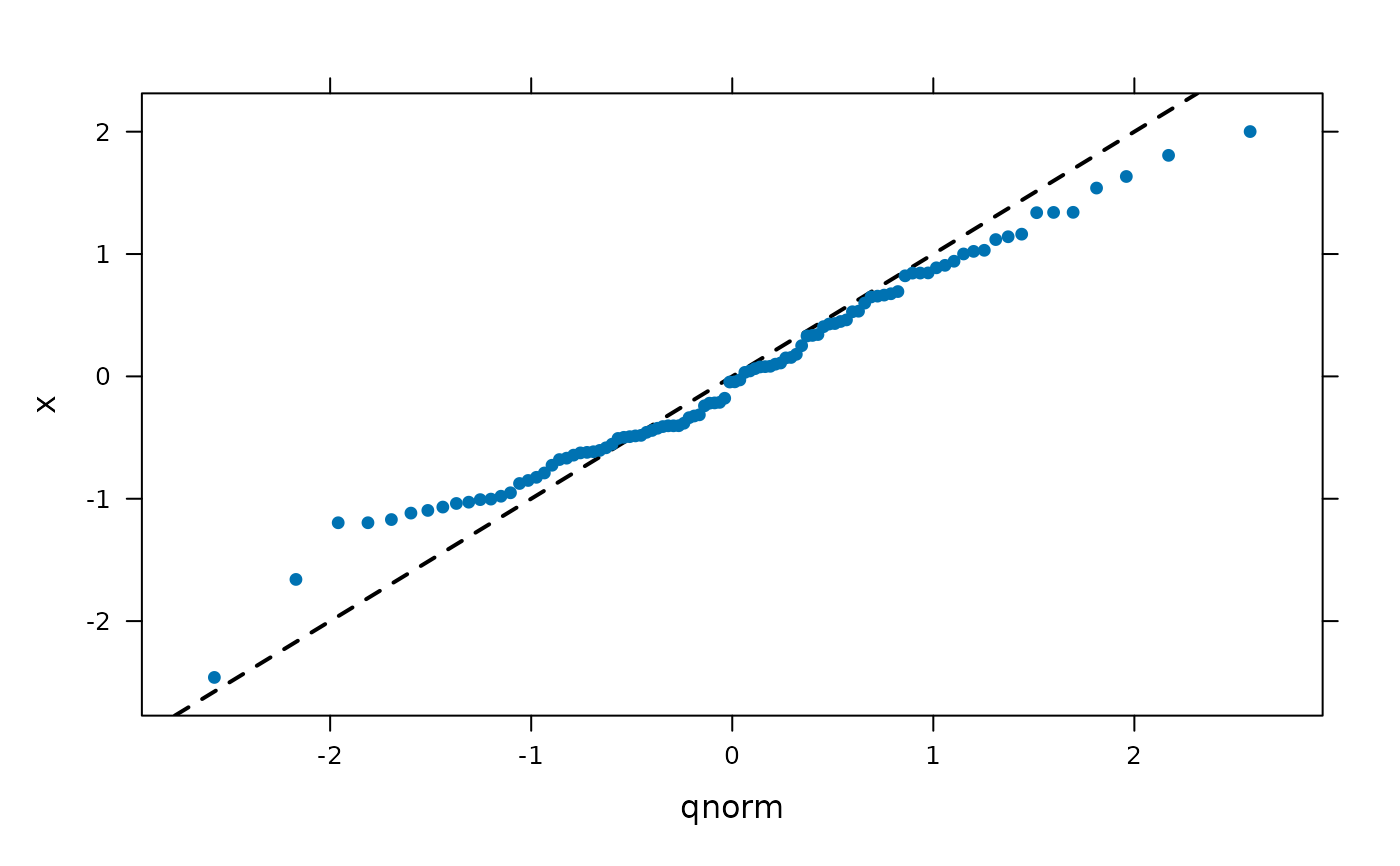
 xqqmath( ~ x, idline = TRUE) # with y = x
 x <- rexp(100, rate = 10)
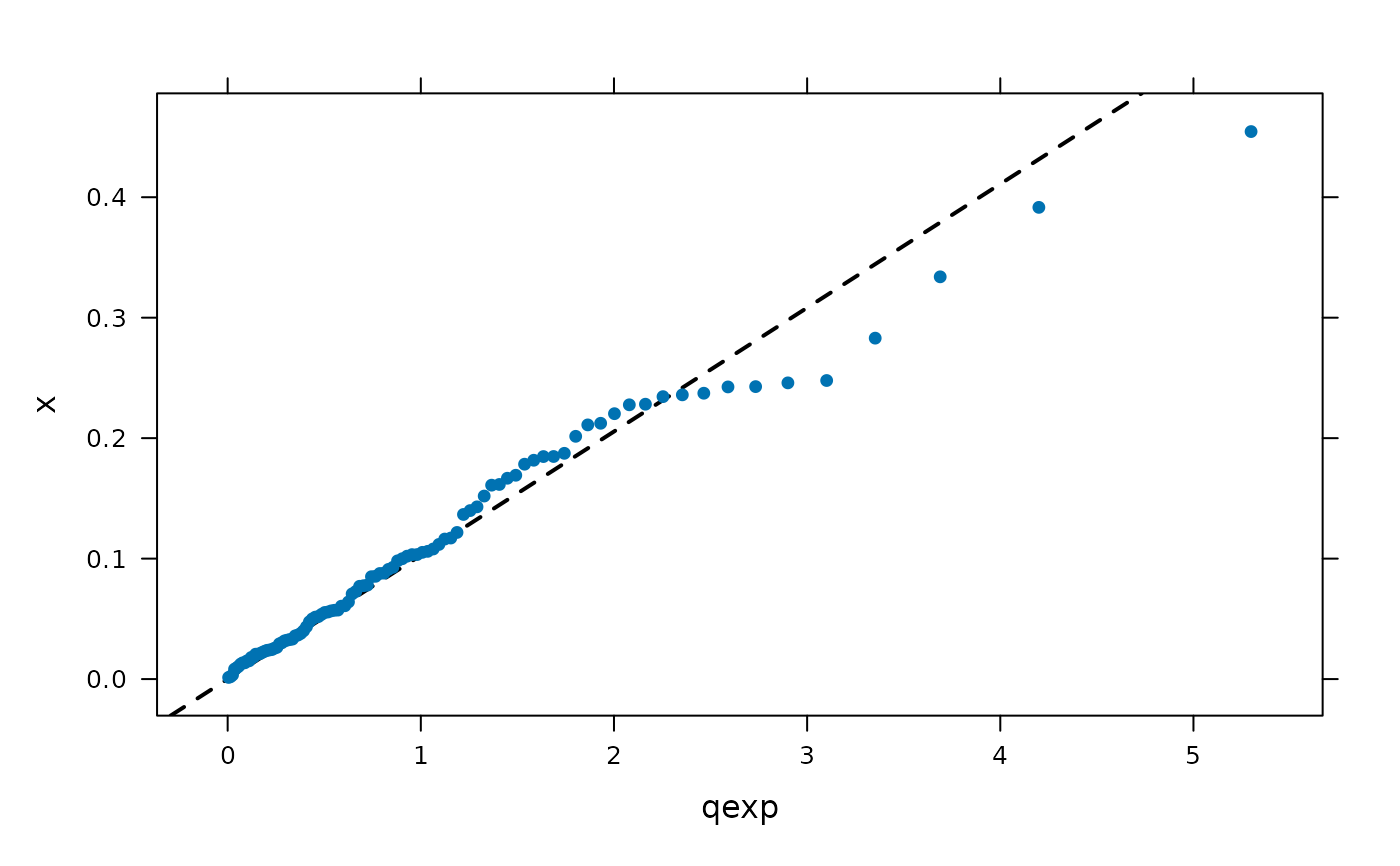
xqqmath( ~ x, distribution = qexp) # with quartile line
x <- rexp(100, rate = 10)
xqqmath( ~ x, distribution = qexp) # with quartile line
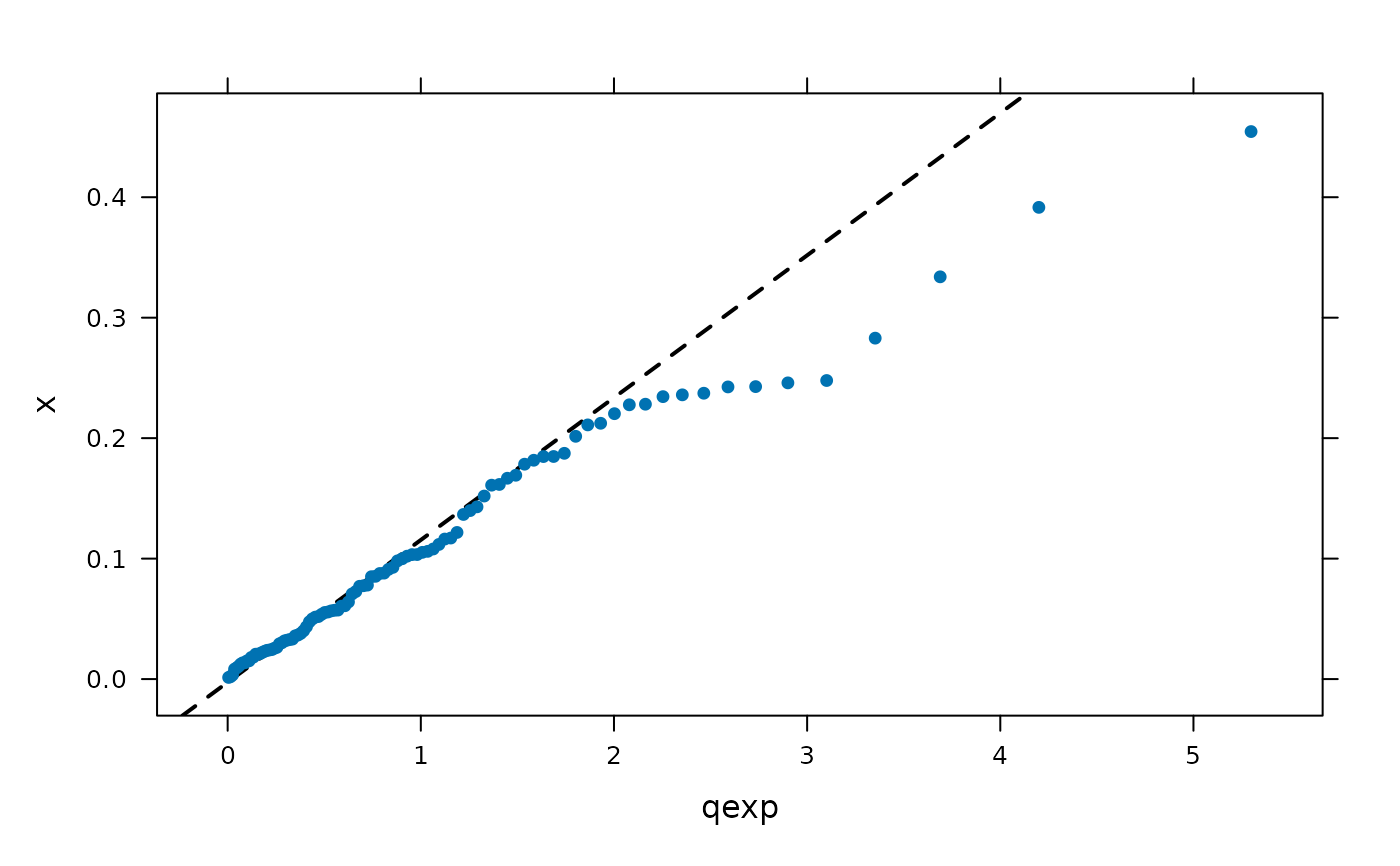 xqqmath( ~ x, distribution = qexp, slope = 1/10)
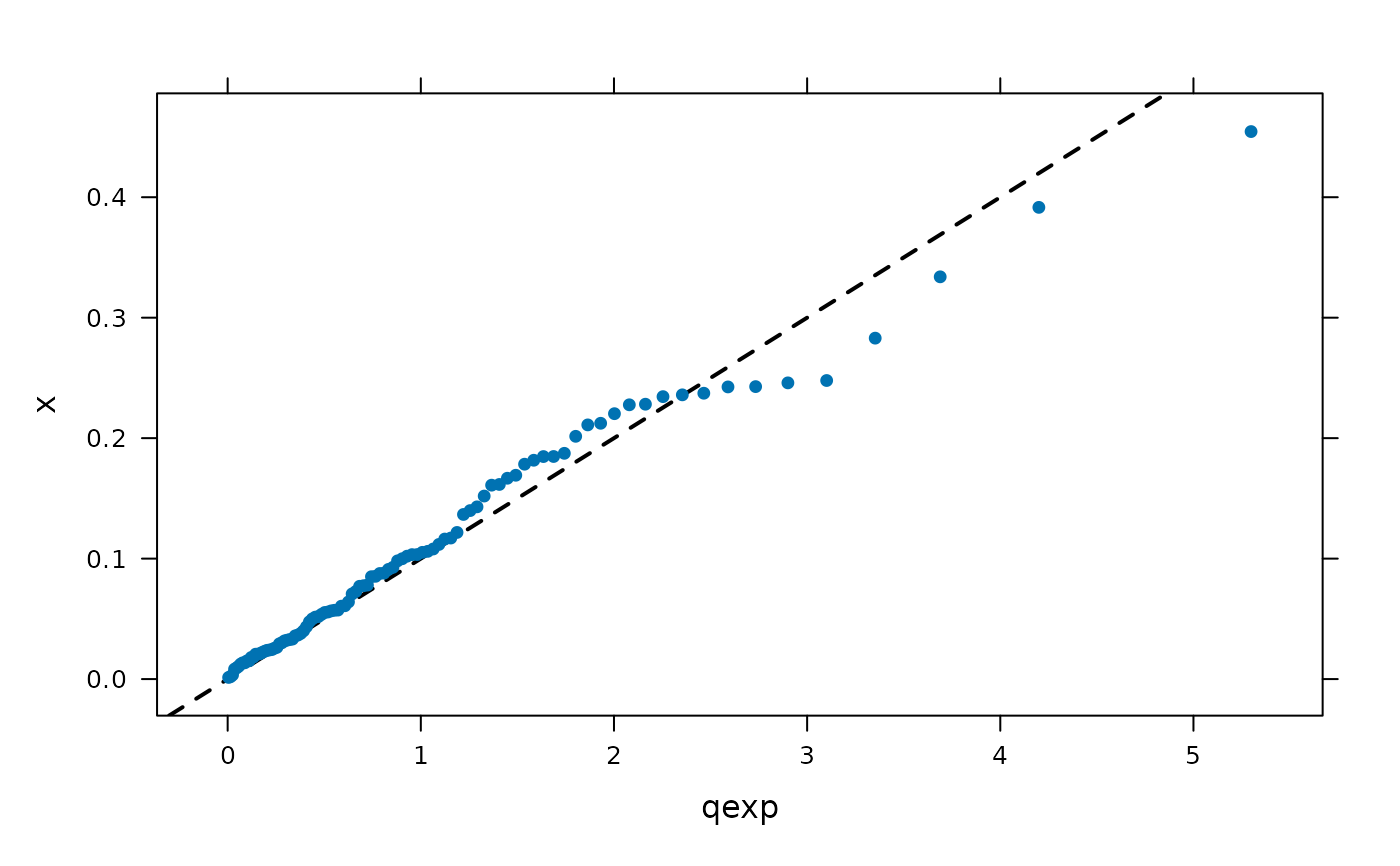 xqqmath( ~ x, distribution = qexp, slope = mean(x))