For each subset of a data frame, apply function then combine results into a
list. dlply is similar to by except that the results
are returned in a different format.
To apply a function for each row, use alply with
.margins set to 1.
Usage
dlply(
  .data,
  .variables,
  .fun = NULL,
  ...,
  .progress = "none",
  .inform = FALSE,
  .drop = TRUE,
  .parallel = FALSE,
  .paropts = NULL
)
Arguments
- .data
data frame to be processed
- .variables
variables to split data frame by, as
as.quotedvariables, a formula or character vector- .fun
function to apply to each piece
- ...
other arguments passed on to
.fun- .progress
name of the progress bar to use, see
create_progress_bar- .inform
produce informative error messages? This is turned off by default because it substantially slows processing speed, but is very useful for debugging
- .drop
should combinations of variables that do not appear in the input data be preserved (FALSE) or dropped (TRUE, default)
- .parallel
if
TRUE, apply function in parallel, using parallel backend provided by foreach- .paropts
a list of additional options passed into the
foreachfunction when parallel computation is enabled. This is important if (for example) your code relies on external data or packages: use the.exportand.packagesarguments to supply them so that all cluster nodes have the correct environment set up for computing.
Output
If there are no results, then this function will return
a list of length 0 (list()).
References
Hadley Wickham (2011). The Split-Apply-Combine Strategy for Data Analysis. Journal of Statistical Software, 40(1), 1-29. https://www.jstatsoft.org/v40/i01/.
Examples
linmod <- function(df) {
lm(rbi ~ year, data = mutate(df, year = year - min(year)))
}
models <- dlply(baseball, .(id), linmod)
models[[1]]
#>
#> Call:
#> lm(formula = rbi ~ year, data = mutate(df, year = year - min(year)))
#>
#> Coefficients:
#> (Intercept) year
#> 118.924 -1.732
#>
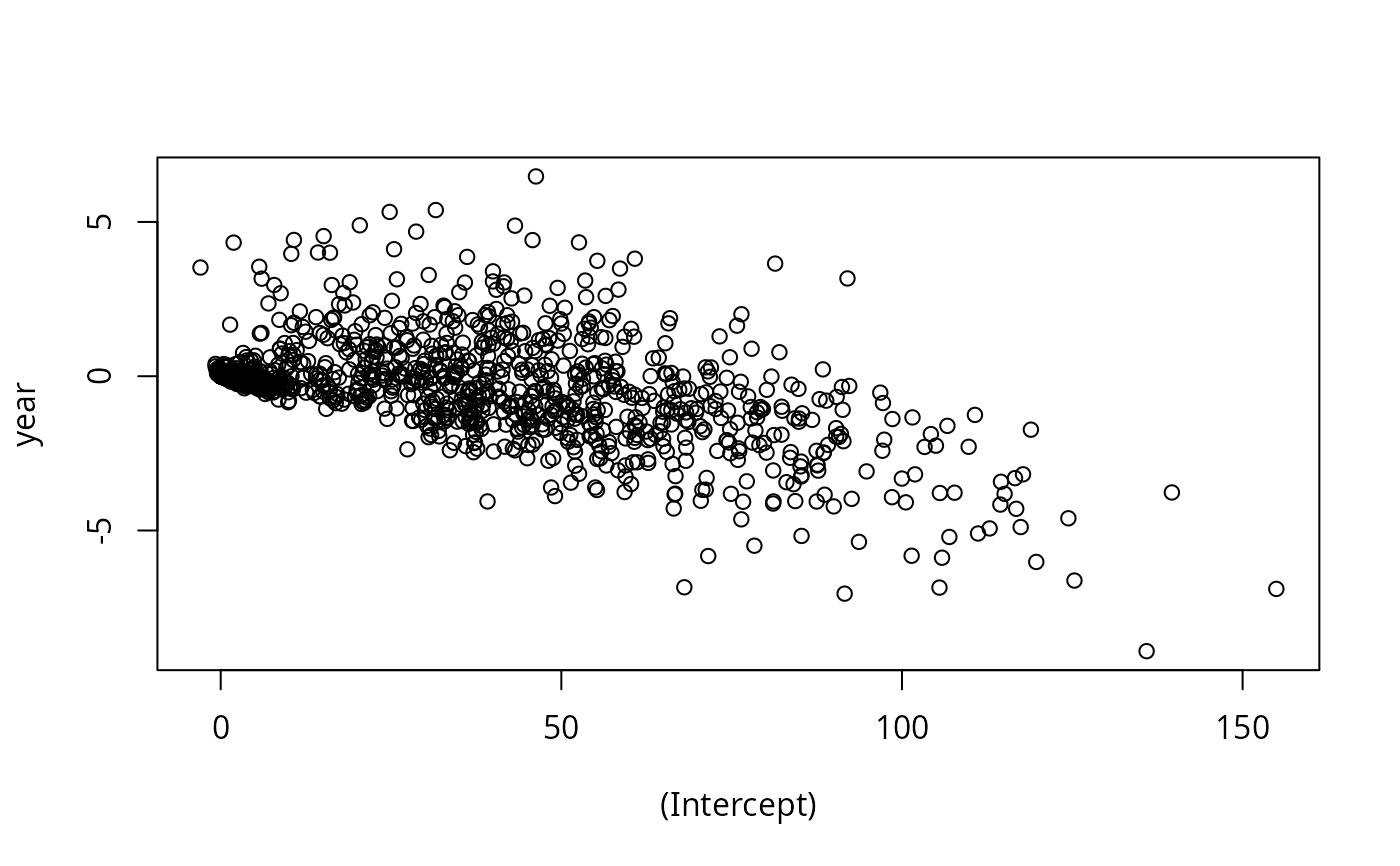
coef <- ldply(models, coef)
with(coef, plot(`(Intercept)`, year))
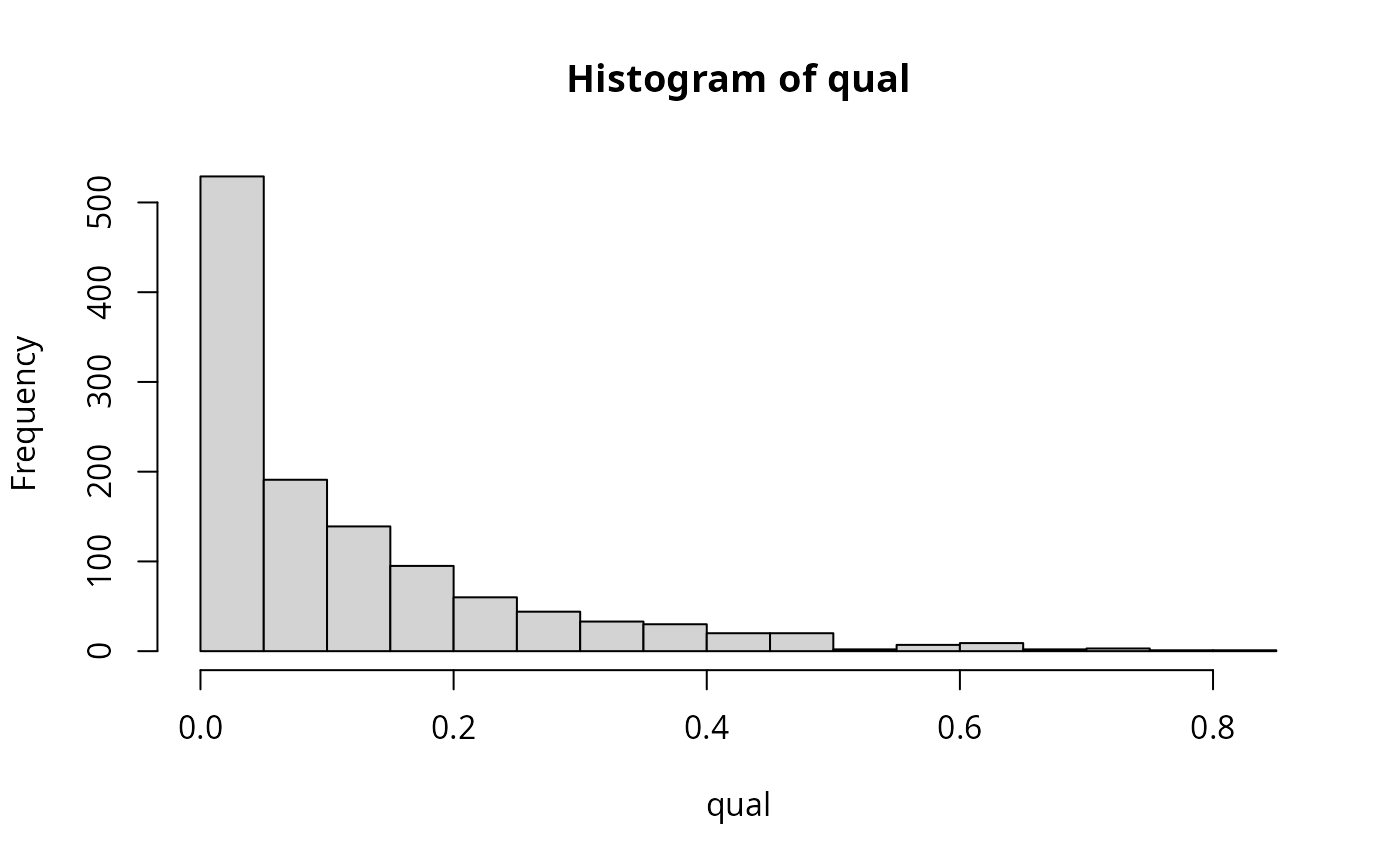
 qual <- laply(models, function(mod) summary(mod)$r.squared)
hist(qual)
qual <- laply(models, function(mod) summary(mod)$r.squared)
hist(qual)