ggplot2 support for Kaplan-Meier and Aalen-Johansen estimators
Usage
ggprodlim(
  x,
  type = x$type,
  cause,
  xlim,
  ylim,
  y_breaks,
  x_breaks,
  position_atrisk,
  atrisk_title = "Number at risk",
  atrisk_labels = NULL,
  atrisk_title_line = 0.14,
  atrisk_title_step = 0.06,
  atrisk_line_step = 0.04,
  atrisk_bottom_margin = NULL,
  facet_panel_spacing_y = NULL,
  conf_int = TRUE,
  conf_int_alpha = 0.2,
  percent = TRUE,
  timeconverter,
  color_var,
  facet_formula,
  palette = NULL,
  return_data = FALSE,
  ...
)
Arguments
- x
An object obtained with
prodlim.- type
Either
"surv"or"risk". Defaults tox$type.- cause
For competing risk models: a cause (passed to
as.data.table.prodlim),"all"for all causes, or"stacked"for a stacked cumulative incidence plot.- xlim, ylim
Limits for the axes.
- x_breaks, y_breaks
Breaks for axes.#
- position_atrisk
Numeric vector specifying x-positions where numbers at risk should be printed. If missing, a default grid is chosen.
- atrisk_title
Title shown left of the at-risk table.
- atrisk_labels
Optional replacement labels for strata/cause groups in the at-risk table (in plotting order).
- atrisk_title_line
Numeric. Position of the at-risk title below the plotting region, as an offset from
min(ylim)in units ofdiff(ylim).- atrisk_title_step
Numeric. Vertical distance from the title to the first at-risk row, in units of
diff(ylim).- atrisk_line_step
Numeric. Vertical spacing between at-risk rows, in units of
diff(ylim).- atrisk_bottom_margin
Numeric. Bottom plot margin in lines when the at-risk table is shown.
- facet_panel_spacing_y
Optional numeric. Vertical spacing between facet rows in lines. If
NULLand faceting is used together with an at-risk table, the default is5 + n_colors. The same value is used as the default bottom plot margin below the lowest facet row.- conf_int
Logical. If TRUE and
lower/upperare available, draw pointwise confidence intervals.- conf_int_alpha
Alpha for CI shading.
- percent
Logical. If TRUE, y axis is shown in percent (0-100).
- timeconverter
Optional character, see
plot.prodlimfor supported values (e.g., "years2months").- color_var
Covariate name must be included in
colnames(x$X))and in competing risk models the word"cause".- facet_formula
Formula for facet_wrap. May include covariate names
colnames(x$X)and in competing risk models also the word"cause".- palette
Optional vector of colors. If provided, applied via
scale_color_manual/scale_fill_manual. Default NULL (do not impose a palette).- return_data
Logical. If TRUE, return a list with plot and data.
- ...
Passed to
as.data.table.prodlim; commonlynewdata,times, and for competing riskscause.
Details
A ggplot2-based alternative to plot.prodlim that returns a
ggplot object, enabling ggplot theming, facetting, and composition.
Examples
data(Melanoma,package = "riskRegression")
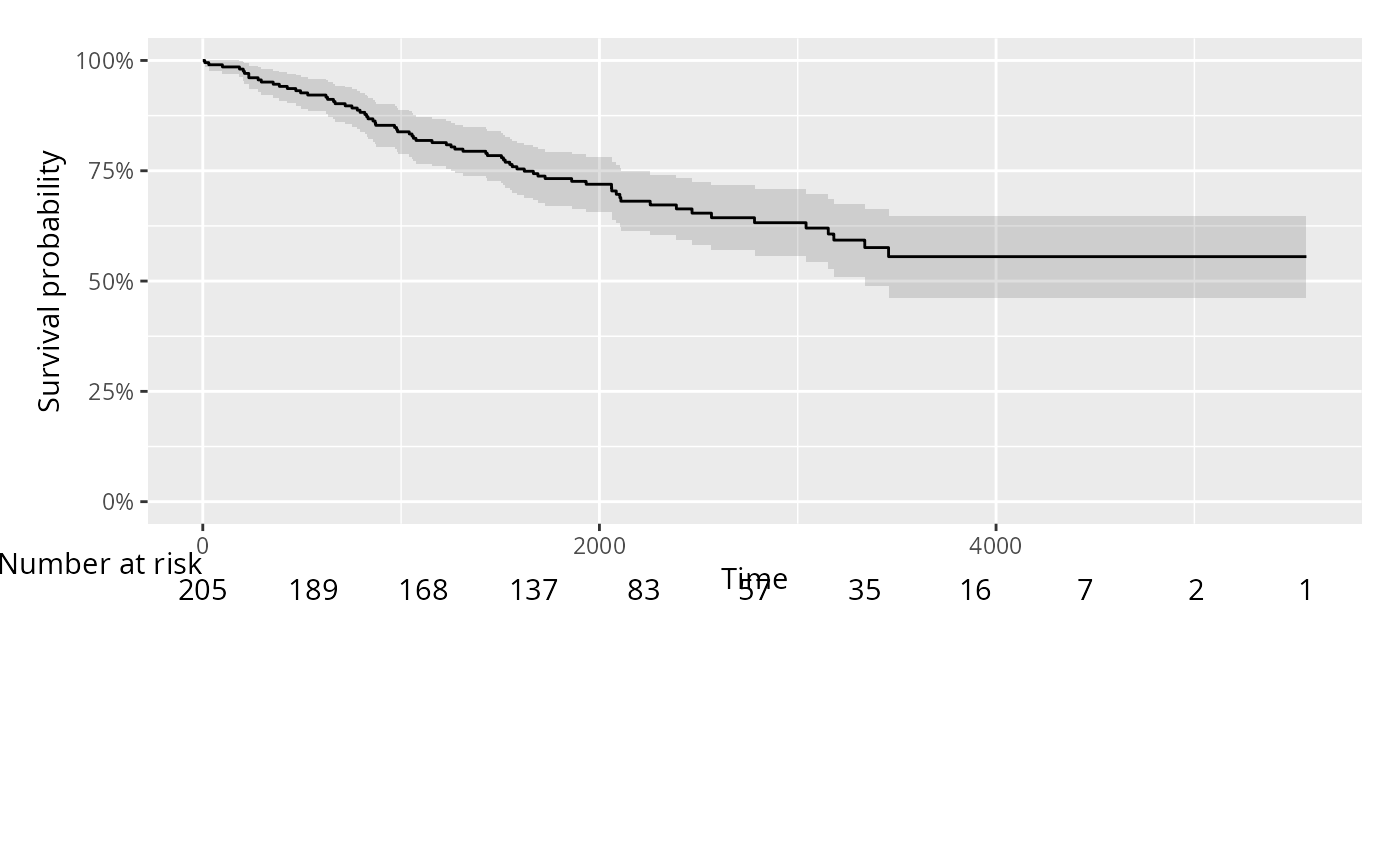
# marginal Kaplan-Maier
km <- prodlim(Hist(time,status != 0)~1,data = Melanoma)
ggprodlim(km)
 # marginal Aalen-Johansen
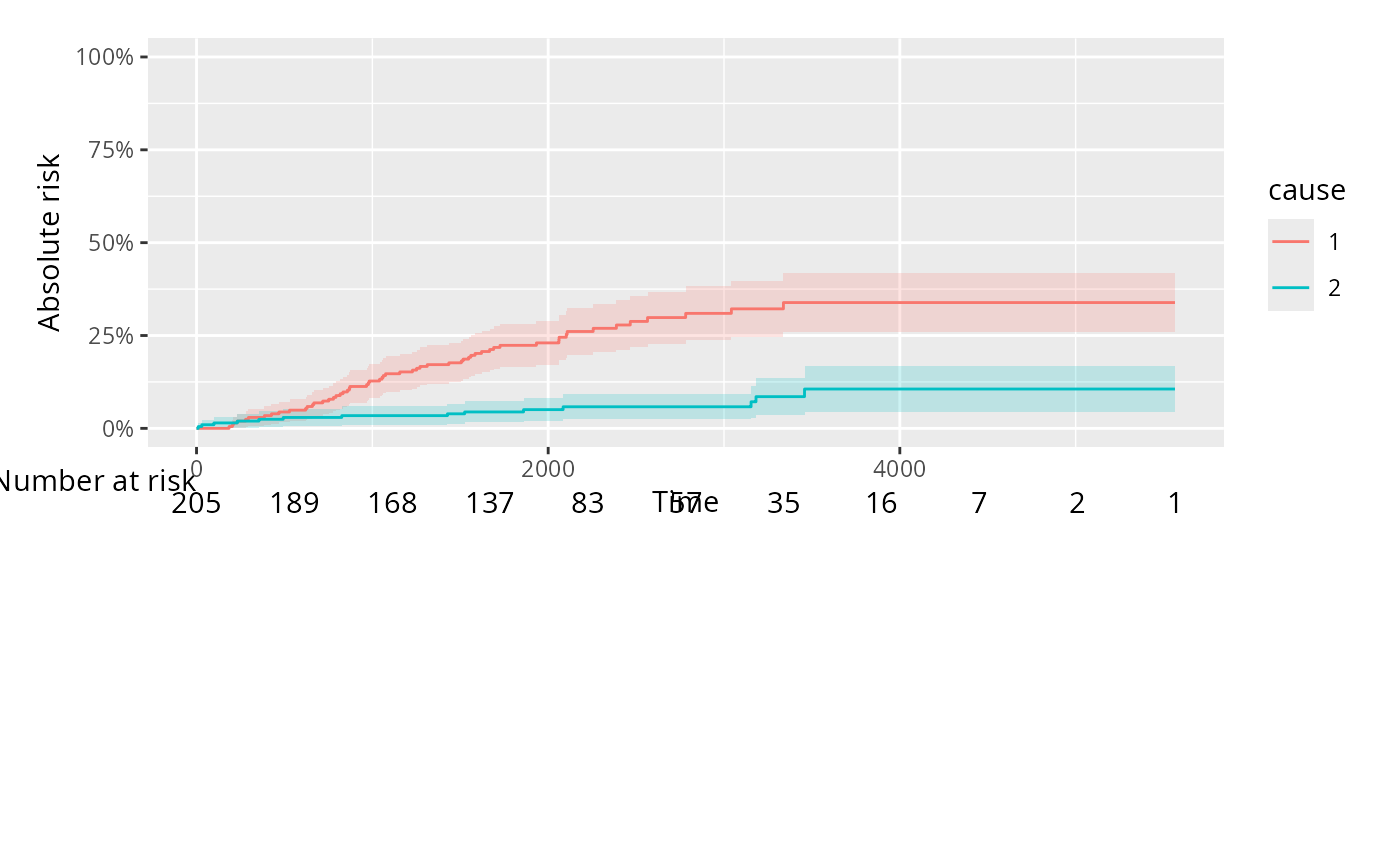
aj <- prodlim(Hist(time,status)~1,data = Melanoma)
ggprodlim(aj)
# marginal Aalen-Johansen
aj <- prodlim(Hist(time,status)~1,data = Melanoma)
ggprodlim(aj)
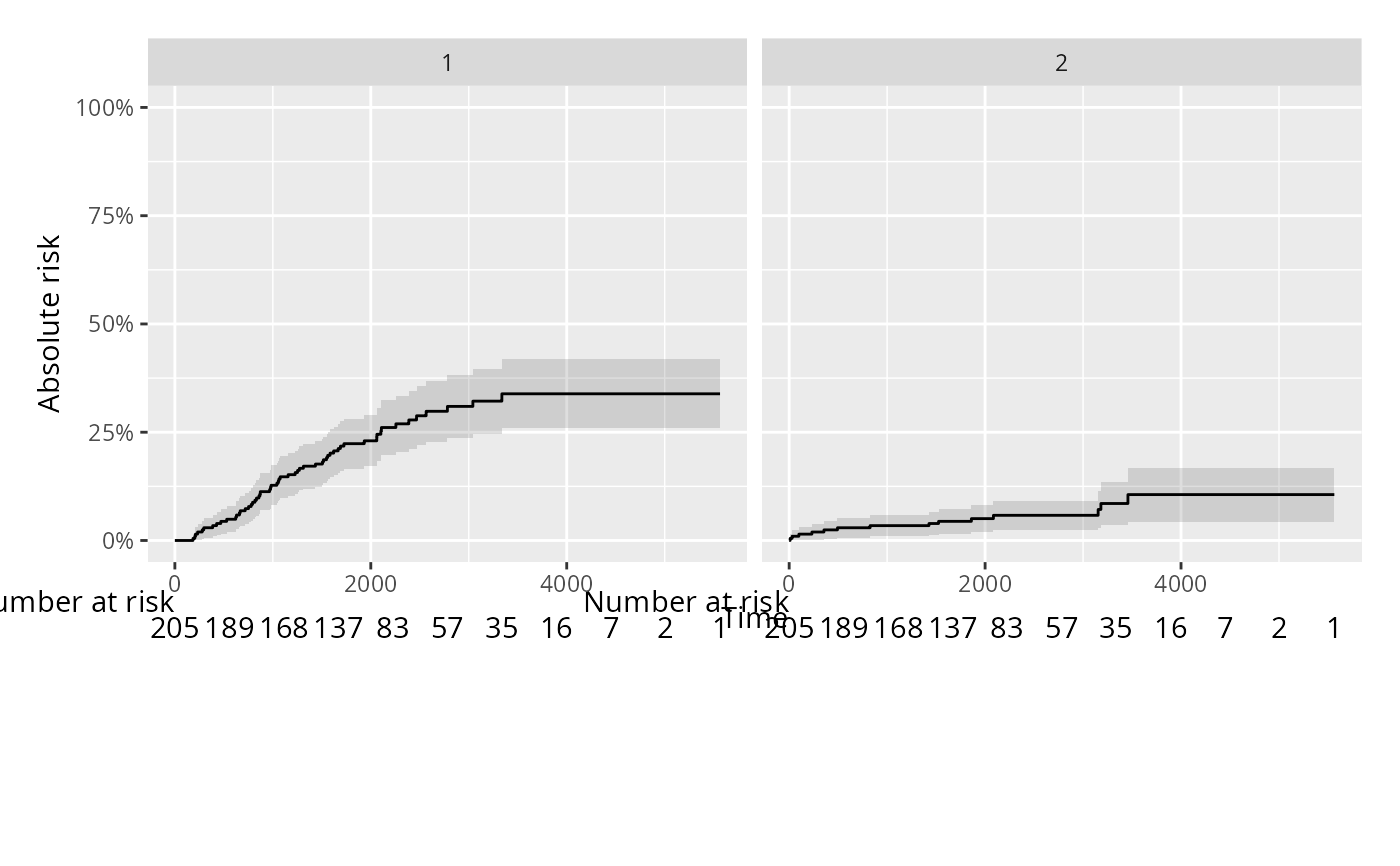
 ggprodlim(aj,facet_formula = ~cause)
 ajsex <- prodlim(Hist(time,status)~sex,data = Melanoma)
ggprodlim(ajsex)
#> Warning: Removed 8 rows containing missing values or values outside the scale range
#> (`geom_step()`).
ajsex <- prodlim(Hist(time,status)~sex,data = Melanoma)
ggprodlim(ajsex)
#> Warning: Removed 8 rows containing missing values or values outside the scale range
#> (`geom_step()`).
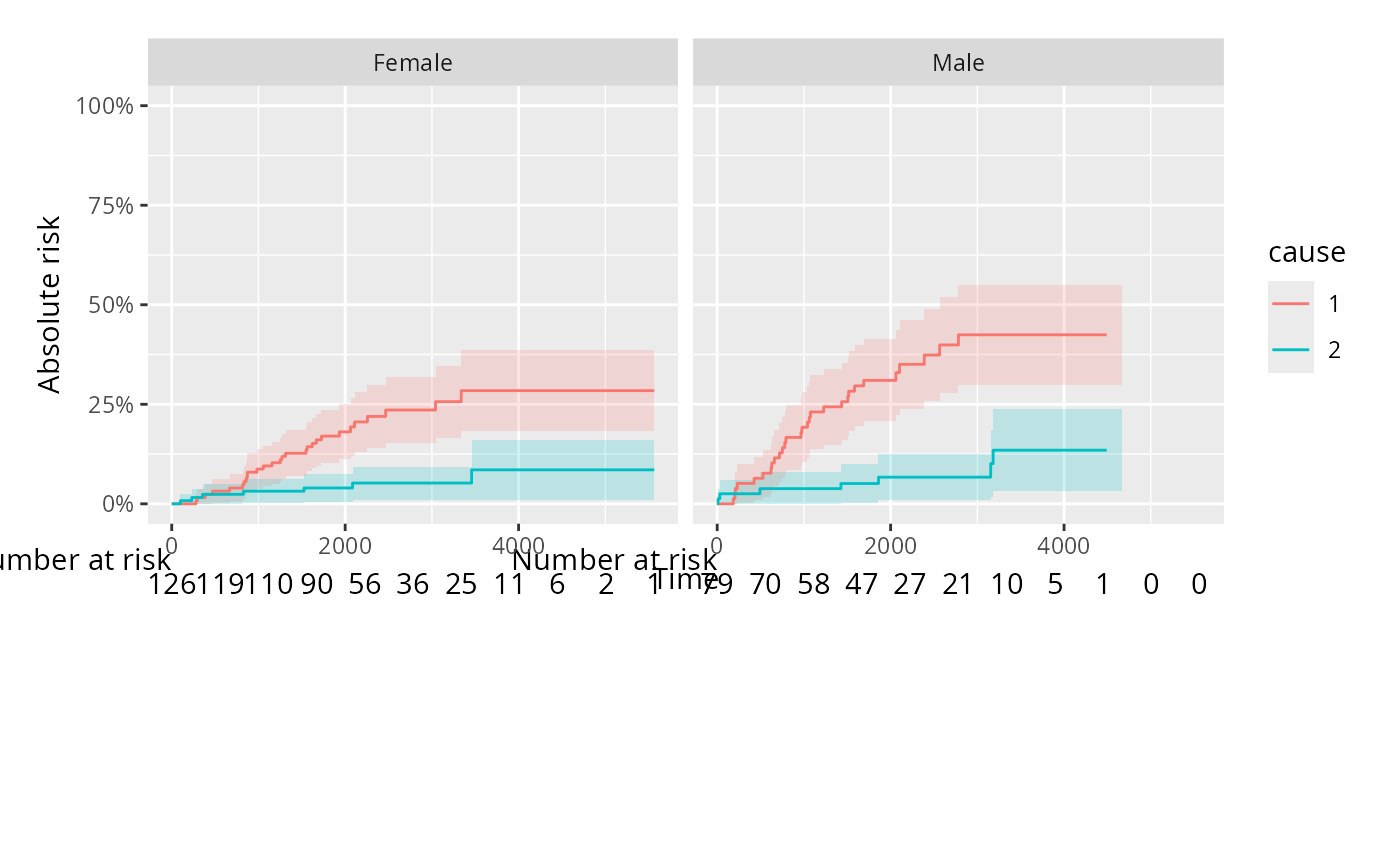 ggprodlim(ajsex,facet_formula = ~cause)
#> Warning: Removed 8 rows containing missing values or values outside the scale range
#> (`geom_step()`).
ggprodlim(ajsex,facet_formula = ~cause)
#> Warning: Removed 8 rows containing missing values or values outside the scale range
#> (`geom_step()`).
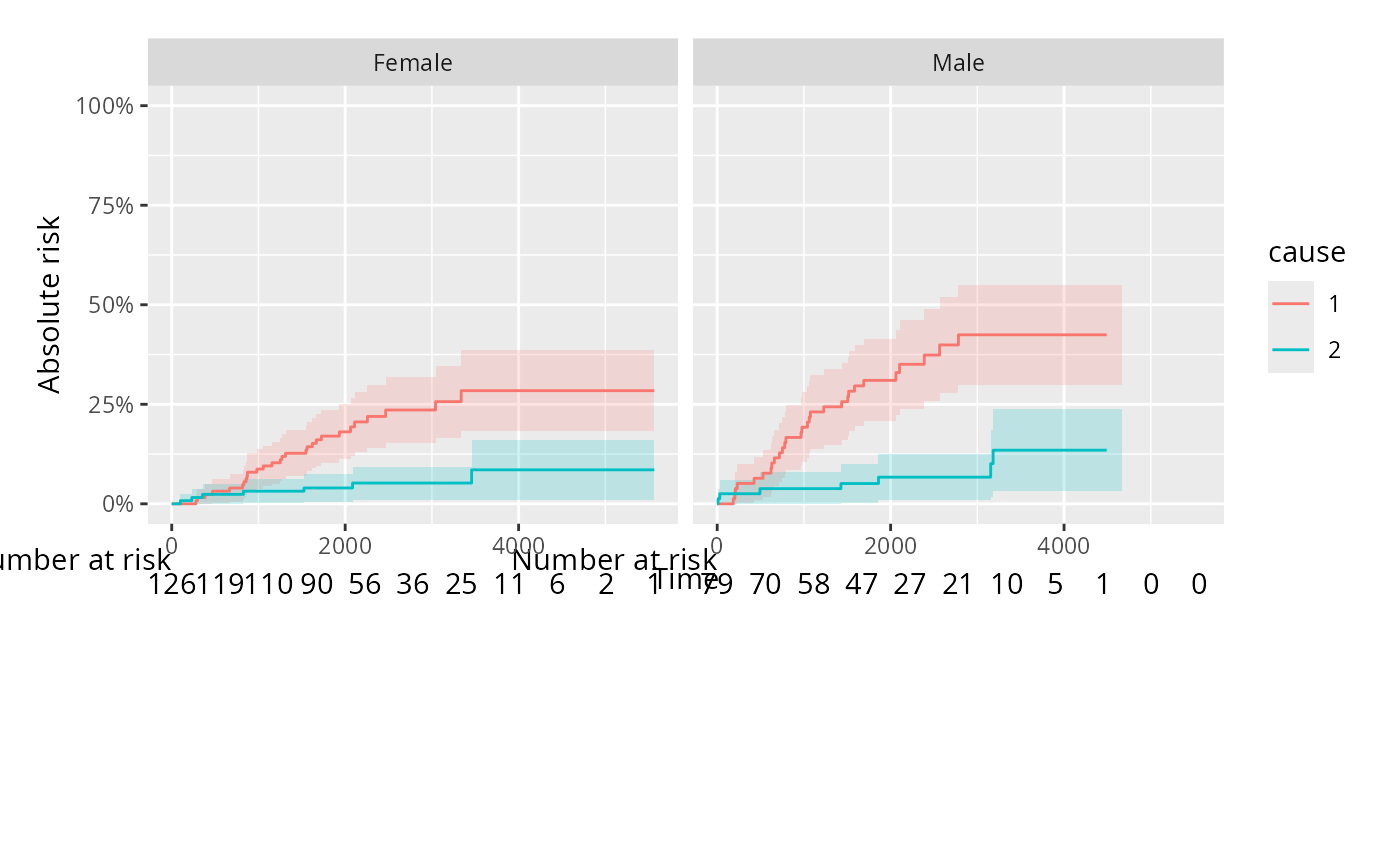
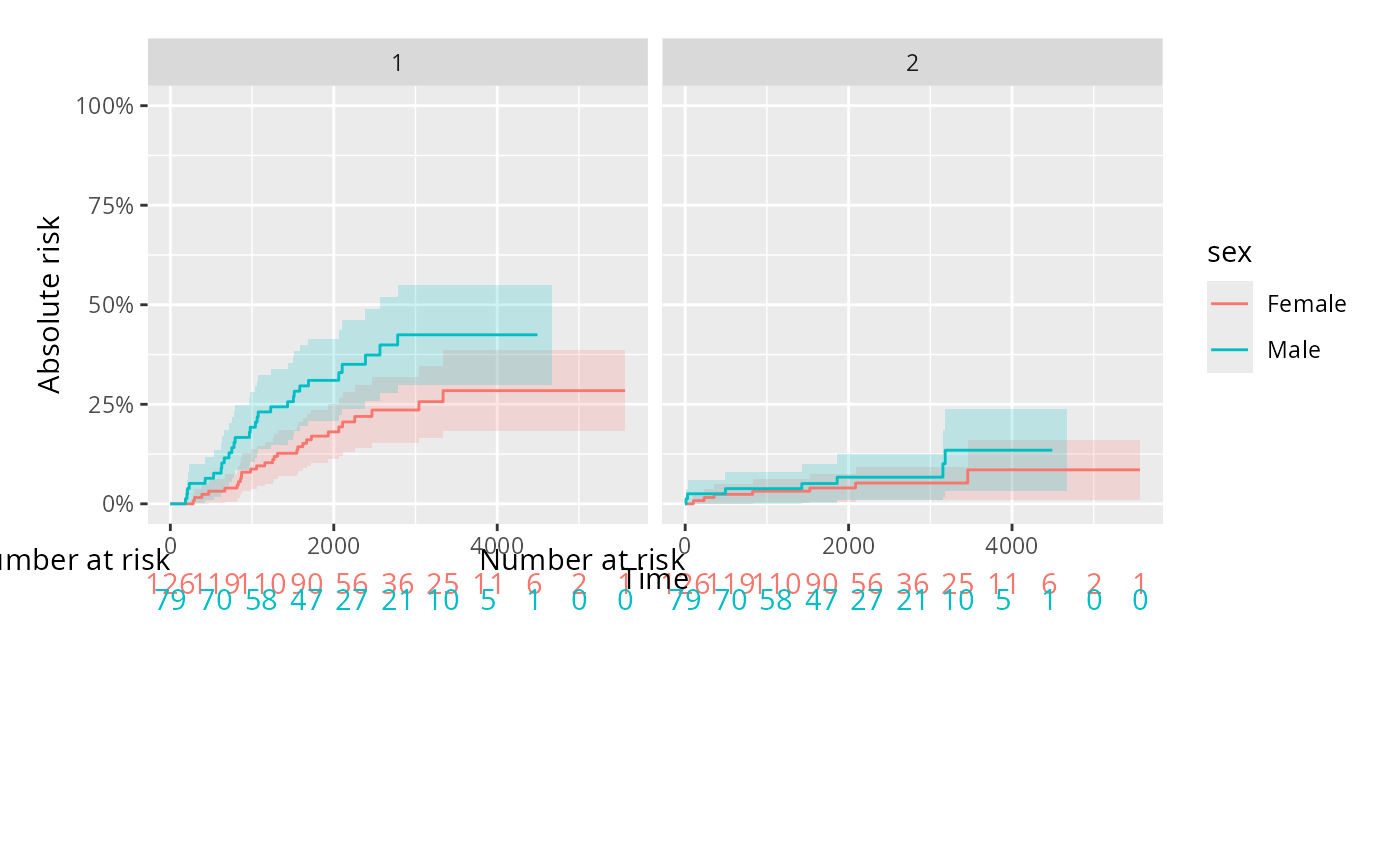 ggprodlim(ajsex,facet_formula = ~sex)
#> Warning: Removed 8 rows containing missing values or values outside the scale range
#> (`geom_step()`).
ggprodlim(ajsex,facet_formula = ~sex)
#> Warning: Removed 8 rows containing missing values or values outside the scale range
#> (`geom_step()`).
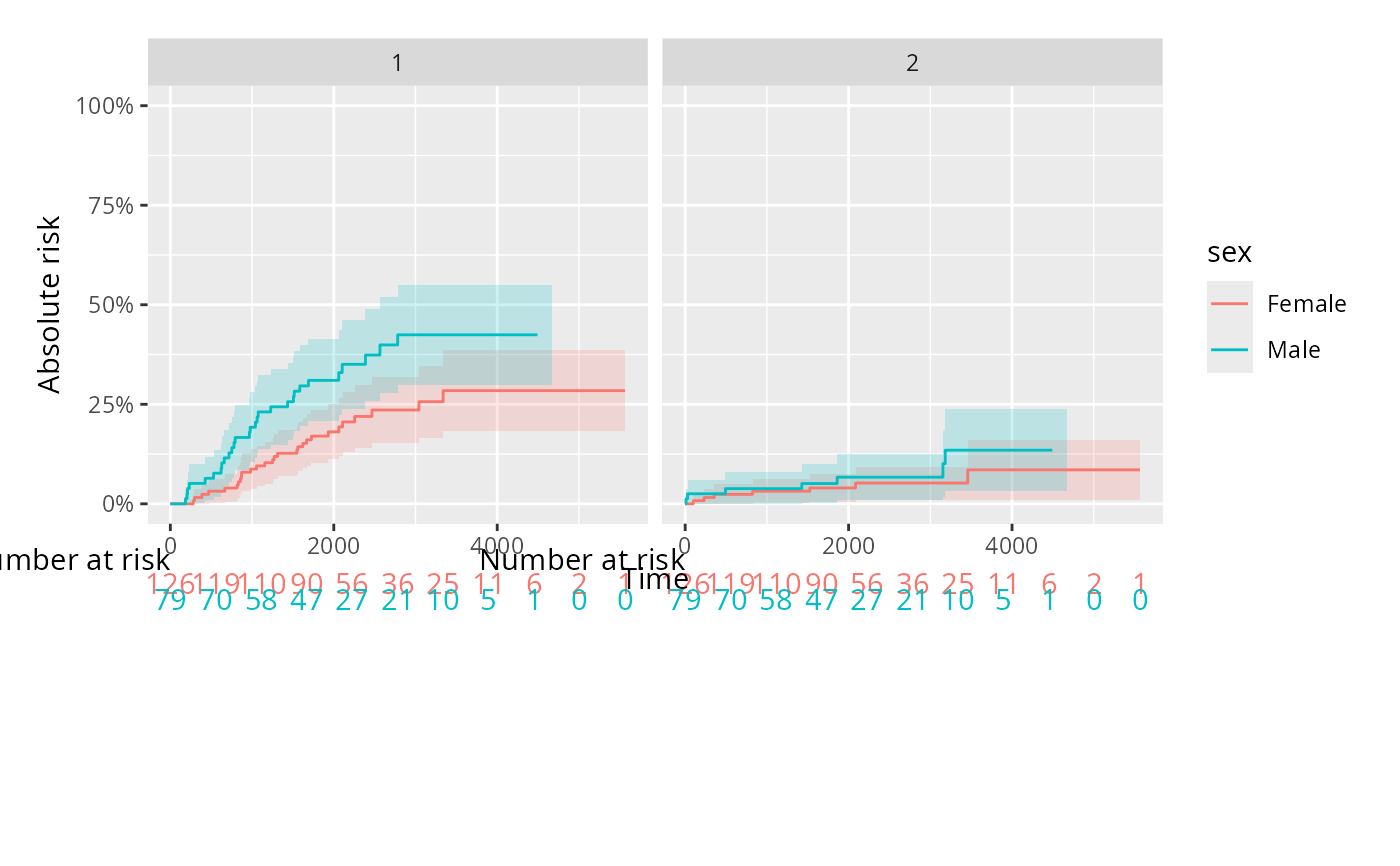
 ggprodlim(ajsex,color_var = "sex")
#> Warning: Removed 8 rows containing missing values or values outside the scale range
#> (`geom_step()`).
ggprodlim(ajsex,color_var = "sex")
#> Warning: Removed 8 rows containing missing values or values outside the scale range
#> (`geom_step()`).
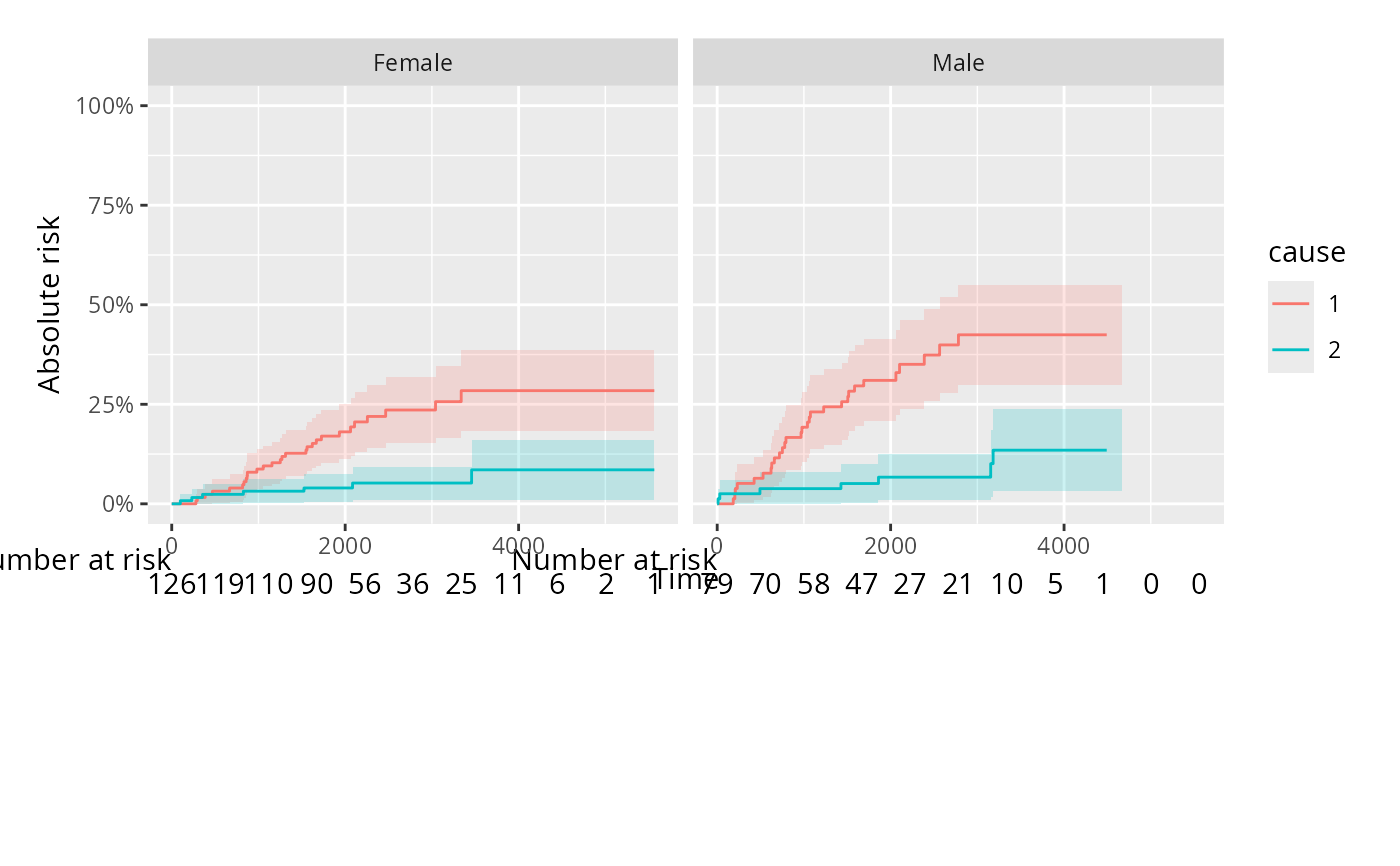
 ggprodlim(ajsex,color_var = "cause")
#> Warning: Removed 8 rows containing missing values or values outside the scale range
#> (`geom_step()`).
ggprodlim(ajsex,color_var = "cause")
#> Warning: Removed 8 rows containing missing values or values outside the scale range
#> (`geom_step()`).
 # stacking the causes
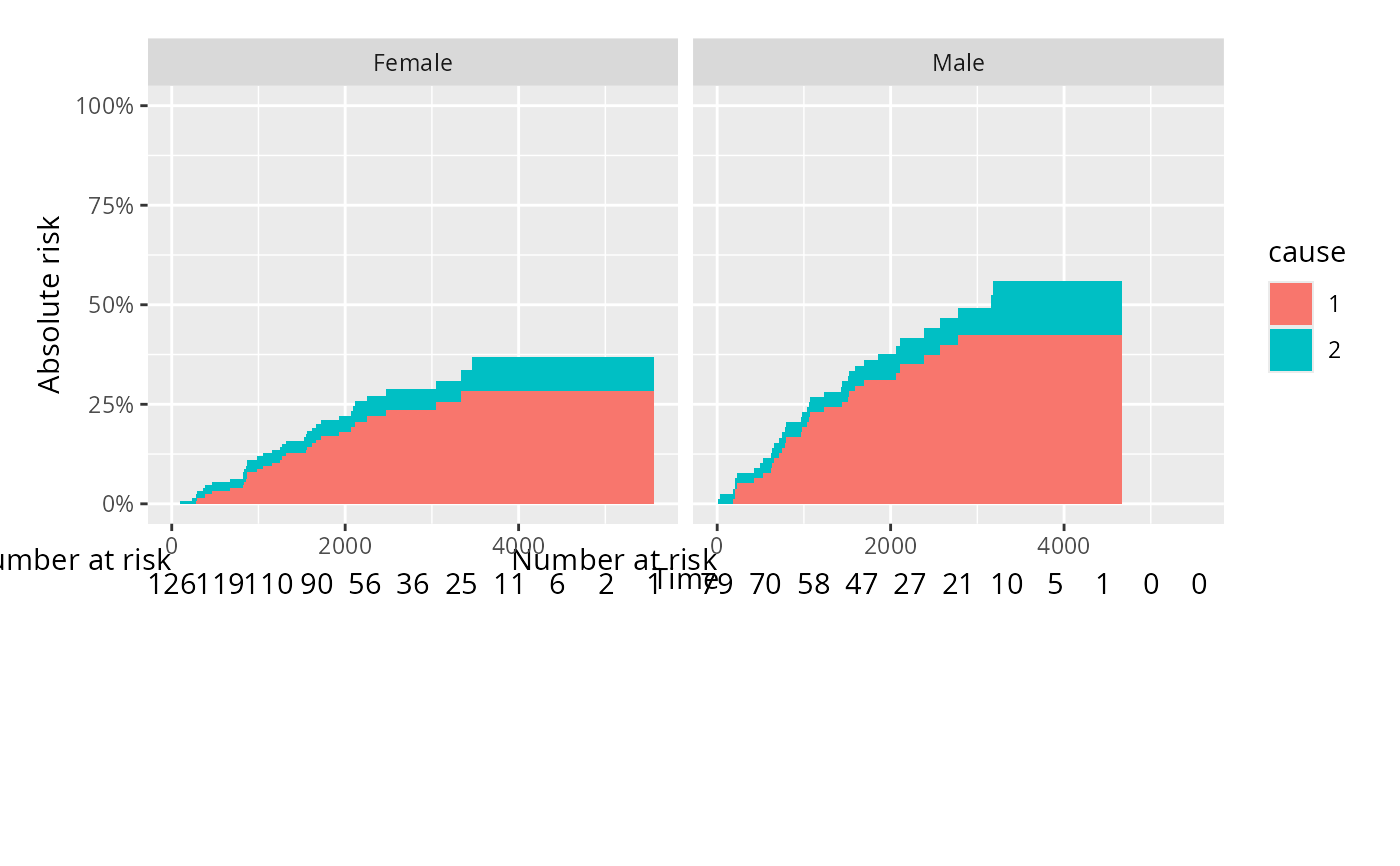
ggprodlim(ajsex,cause = "stacked")
# stacking the causes
ggprodlim(ajsex,cause = "stacked")
 # stacked with two covariates
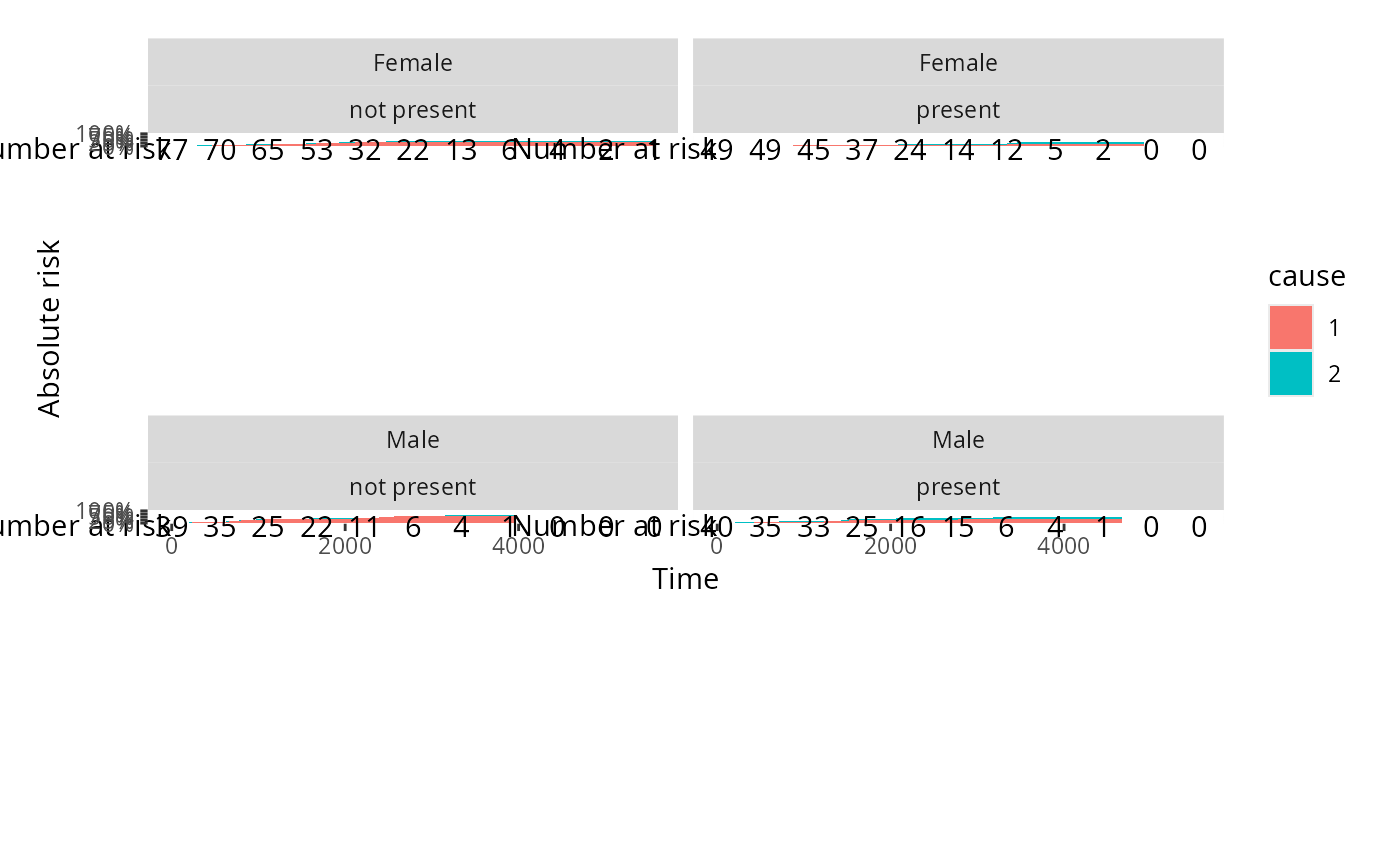
ajepisex <- prodlim(Hist(time,status)~sex+epicel,data = Melanoma)
ggprodlim(ajepisex,
cause = "stacked",
facet_formula = sex~epicel,
atrisk_title_line = 0.2)
# stacked with two covariates
ajepisex <- prodlim(Hist(time,status)~sex+epicel,data = Melanoma)
ggprodlim(ajepisex,
cause = "stacked",
facet_formula = sex~epicel,
atrisk_title_line = 0.2)