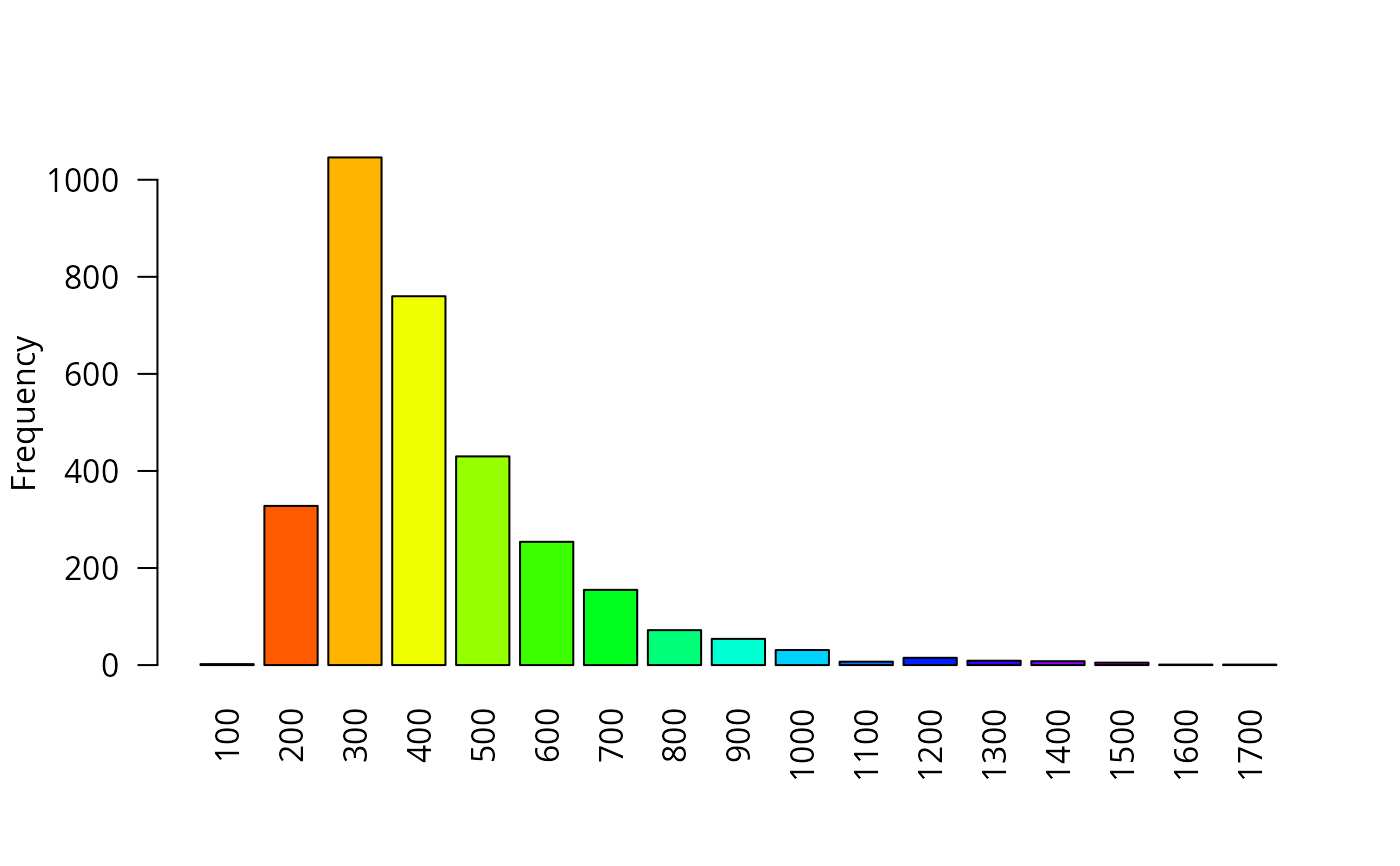
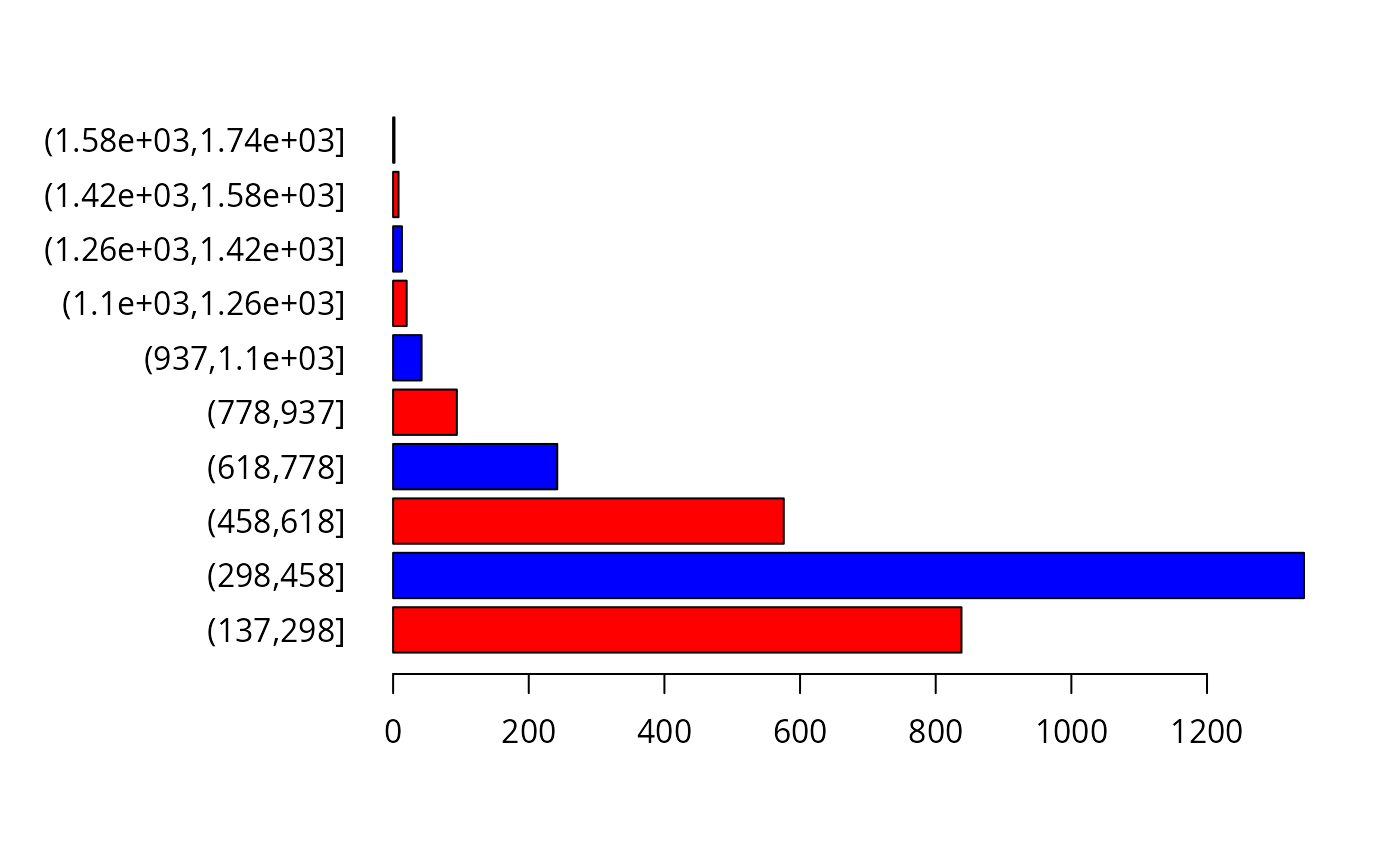
Bar plot of a RasterLayer
barplot.RdCreate a barplot of the values of a RasterLayer. For large datasets a regular sample with a size of approximately maxpixels is used.
Usage
# S4 method for class 'RasterLayer'
barplot(height, maxpixels=1000000, digits=0, breaks=NULL, col=rainbow, ...)
Arguments
- height
RasterLayer
- maxpixels
integer. To regularly subsample very large objects
- digits
integer used to determine how to
roundthe values before tabulating. Set toNULLor to a large number if you do not want any rounding- breaks
breaks used to group the data as in
cut- col
a color generating function such as
rainbow, or a vector of colors- ...
additional arguments for plotting as in
barplot
Value
A numeric vector (or matrix, when beside = TRUE) of the coordinates of the bar midpoints, useful for adding to the graph. See barplot