Histogram
hist.RdCreate a histogram of the values of a RasterLayer. For large datasets a sample is used.
Arguments
- x
Raster* object
- layer
integer (or character) to indicate layer number (or name). Can be used to subset the layers to plot in a multilayer Raster* object
- maxpixels
integer. To regularly subsample very large objects
- plot
logical. Plot the histogram or only return the histogram values
- main
character. Main title(s) for the plot. Default is the value of
names- ...
Additional arguments. See under Methods and at
hist
Value
This function is principally used for the side-effect of plotting a histogram, but it also returns an S3 object of class 'histogram' (invisibly if plot=TRUE).
Examples
r1 <- raster(nrows=50, ncols=50)
r1 <- setValues(r1, runif(ncell(r1)))
r2 <- setValues(r1, runif(ncell(r1)))
rs <- r1 + r2
rp <- r1 * r2
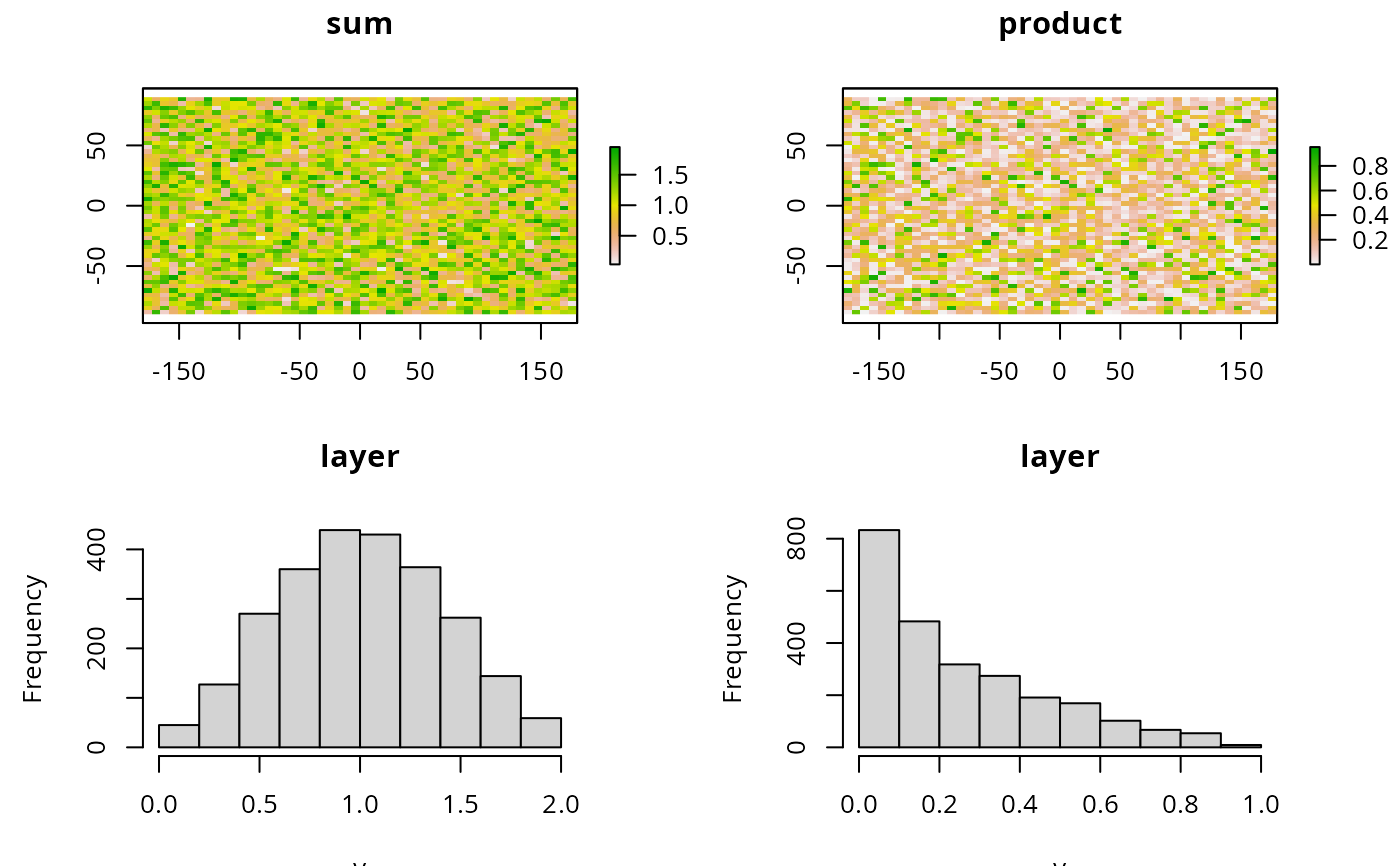
par(mfrow=c(2,2))
plot(rs, main='sum')
plot(rp, main='product')
hist(rs)
a = hist(rp)
 a
#> $breaks
#> [1] 0.0 0.1 0.2 0.3 0.4 0.5 0.6 0.7 0.8 0.9 1.0
#>
#> $counts
#> [1] 833 483 318 274 191 169 102 67 54 9
#>
#> $density
#> [1] 3.332 1.932 1.272 1.096 0.764 0.676 0.408 0.268 0.216 0.036
#>
#> $mids
#> [1] 0.05 0.15 0.25 0.35 0.45 0.55 0.65 0.75 0.85 0.95
#>
#> $xname
#> [1] "v"
#>
#> $equidist
#> [1] TRUE
#>
#> attr(,"class")
#> [1] "histogram"
a
#> $breaks
#> [1] 0.0 0.1 0.2 0.3 0.4 0.5 0.6 0.7 0.8 0.9 1.0
#>
#> $counts
#> [1] 833 483 318 274 191 169 102 67 54 9
#>
#> $density
#> [1] 3.332 1.932 1.272 1.096 0.764 0.676 0.408 0.268 0.216 0.036
#>
#> $mids
#> [1] 0.05 0.15 0.25 0.35 0.45 0.55 0.65 0.75 0.85 0.95
#>
#> $xname
#> [1] "v"
#>
#> $equidist
#> [1] TRUE
#>
#> attr(,"class")
#> [1] "histogram"