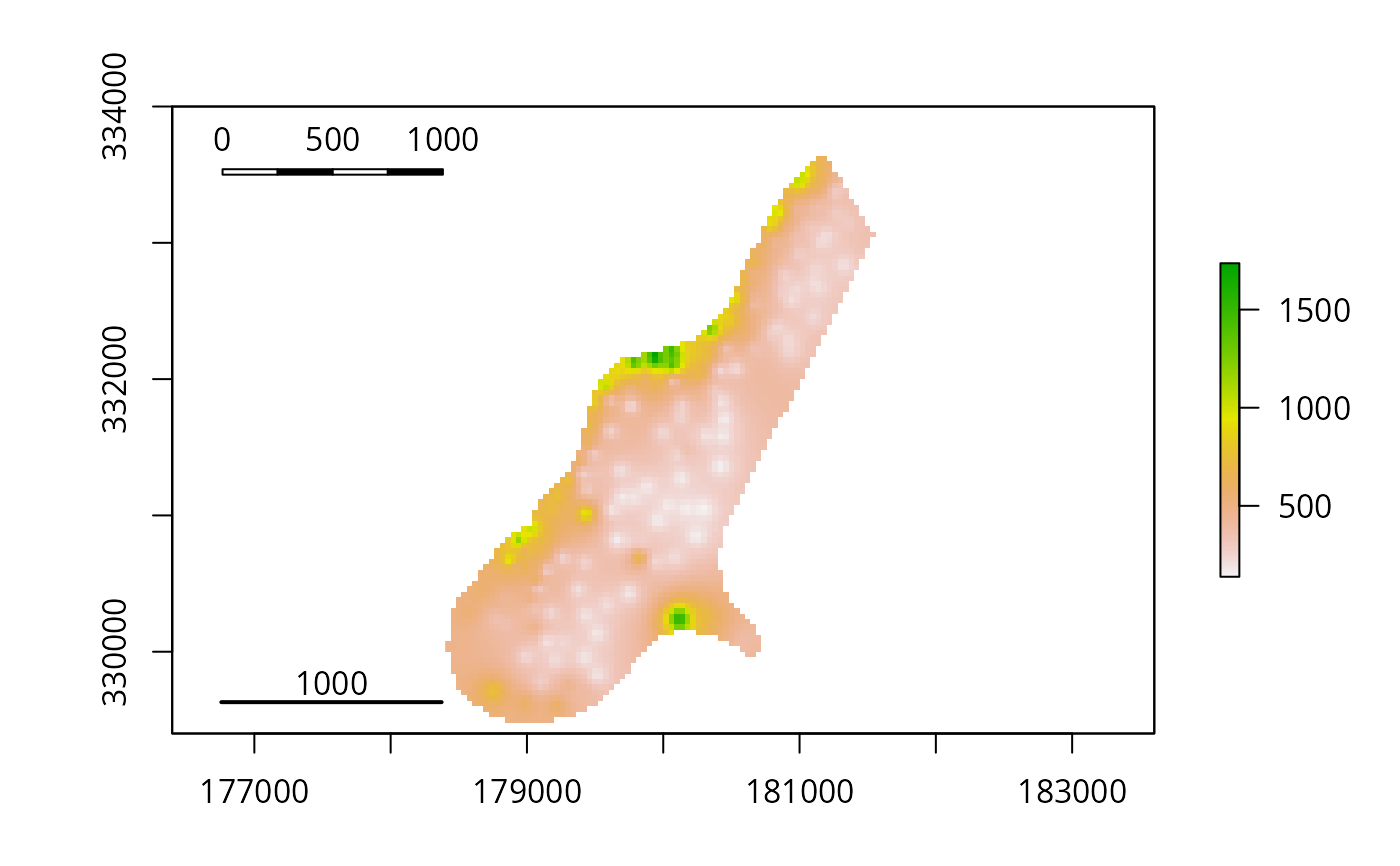
scalebar
scalebar.RdAdd a scalebar to a plot
Usage
scalebar(d, xy = NULL, type = "line", divs = 2, below = "",
       lonlat = NULL, label, adj=c(0.5, -0.5), lwd = 2, ...)
Arguments
- d
distance covered by scalebar
- xy
x and y coordinate to place the plot. Can be NULL. Use
xy=click()to make this interactive- type
"line" or "bar"
- divs
Number of divisions for a bar type. 2 or 4
- below
Text to go below scalebar (e.g., "kilometers")
- lonlat
Logical or NULL. If logical,
TRUEindicates if the plot is using longitude/latitude coordinates. IfNULLthis is guessed from the plot's coordinates- adj
adjustment for text placement
- label
Vector of three numbers to label the scale bar (beginning, midpoint, end)
- lwd
line width for the "line" type scalebar
- ...
arguments to be passed to other methods
Examples
f <- system.file("external/test.grd", package="raster")
r <- raster(f)
plot(r)
scalebar(1000)
scalebar(1000, xy=c(178000, 333500), type='bar', divs=4)