Add labels to a map
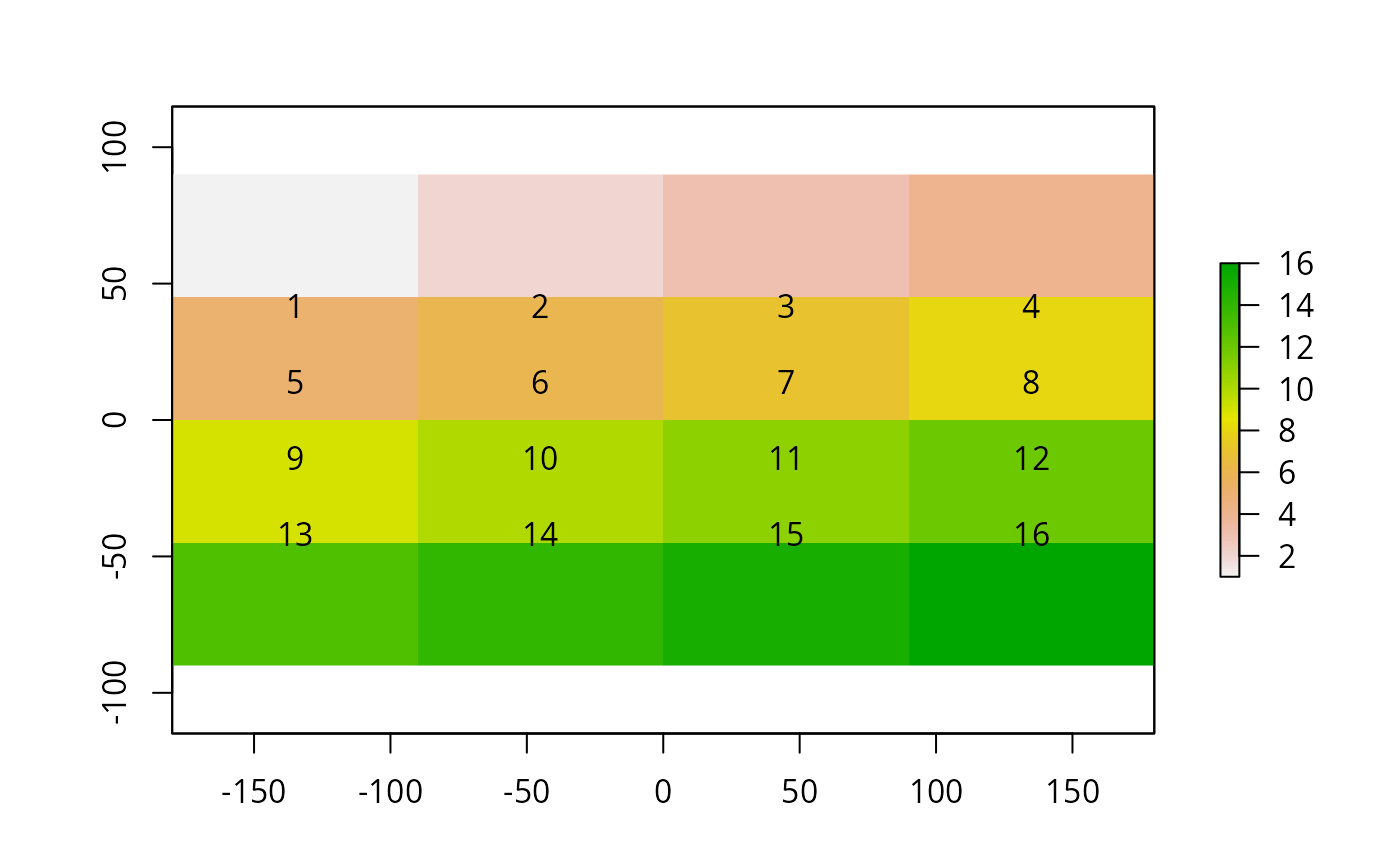
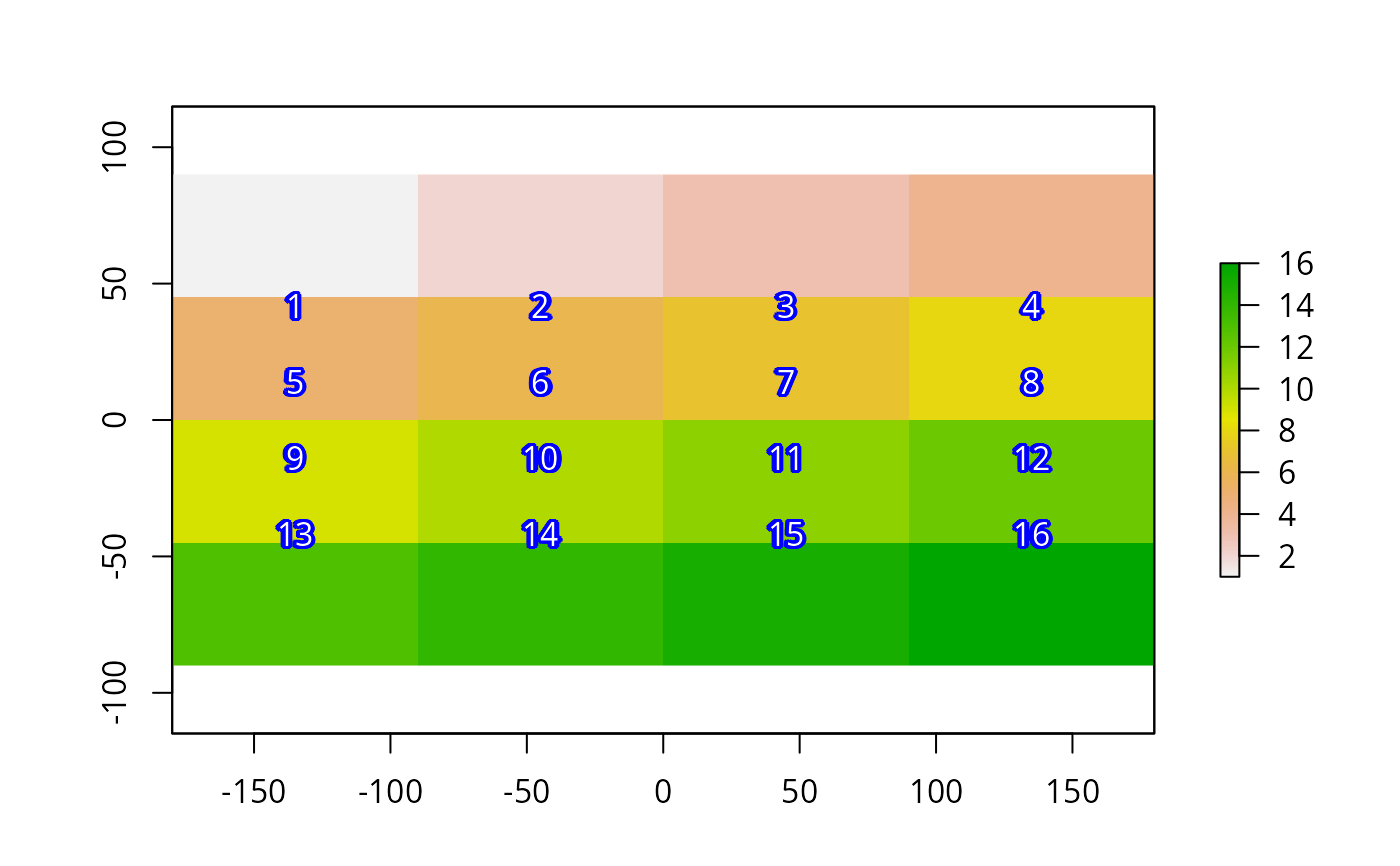
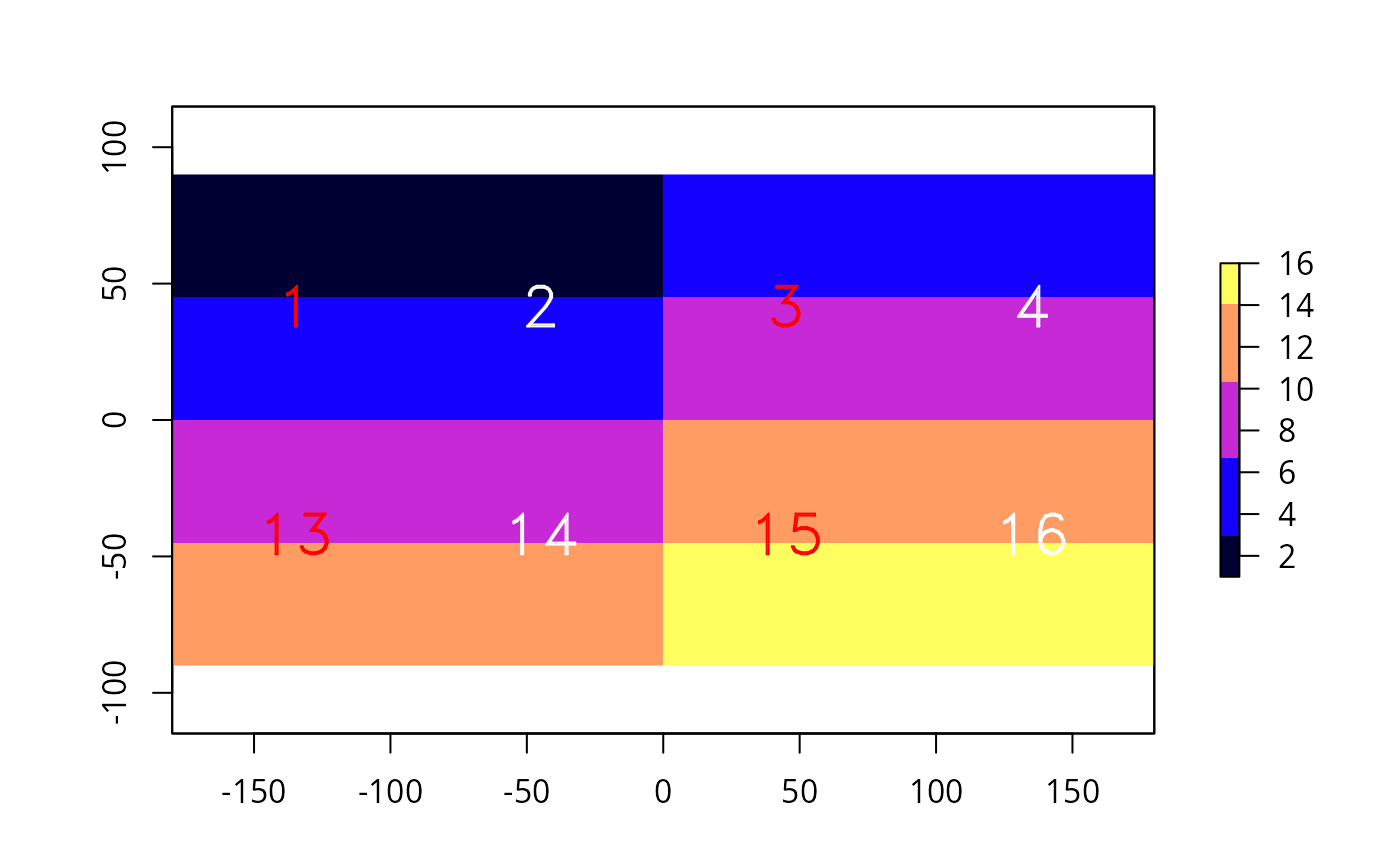
text.RdPlots labels, that is a textual (rather than color) representation of values, on top an existing plot (map).
Usage
# S4 method for class 'RasterLayer'
text(x, labels, digits=0, fun=NULL, halo=FALSE, ...)

# S4 method for class 'RasterStackBrick'
text(x, labels, digits=0, fun=NULL, halo=FALSE, ...)

# S4 method for class 'SpatialPolygons'
text(x, labels, halo=FALSE, ...)

# S4 method for class 'SpatialPoints'
text(x, labels, halo=FALSE, ...)
Arguments
- x
Raster*, SpatialPoints* or SpatialPolygons* object
- labels
character. Optional. Vector of labels with
length(x)or a variable name fromnames(x)- digits
integer. how many digits should be used?
- fun
function to subset the values plotted (as in
rasterToPoints)- halo
logical. If
TRUEa 'halo' is printed around the text. IfTRUE, additional argumentshc='white'andhw=0.1can be modified to set the colour and width of the halo- ...
additional arguments to pass to graphics function
text