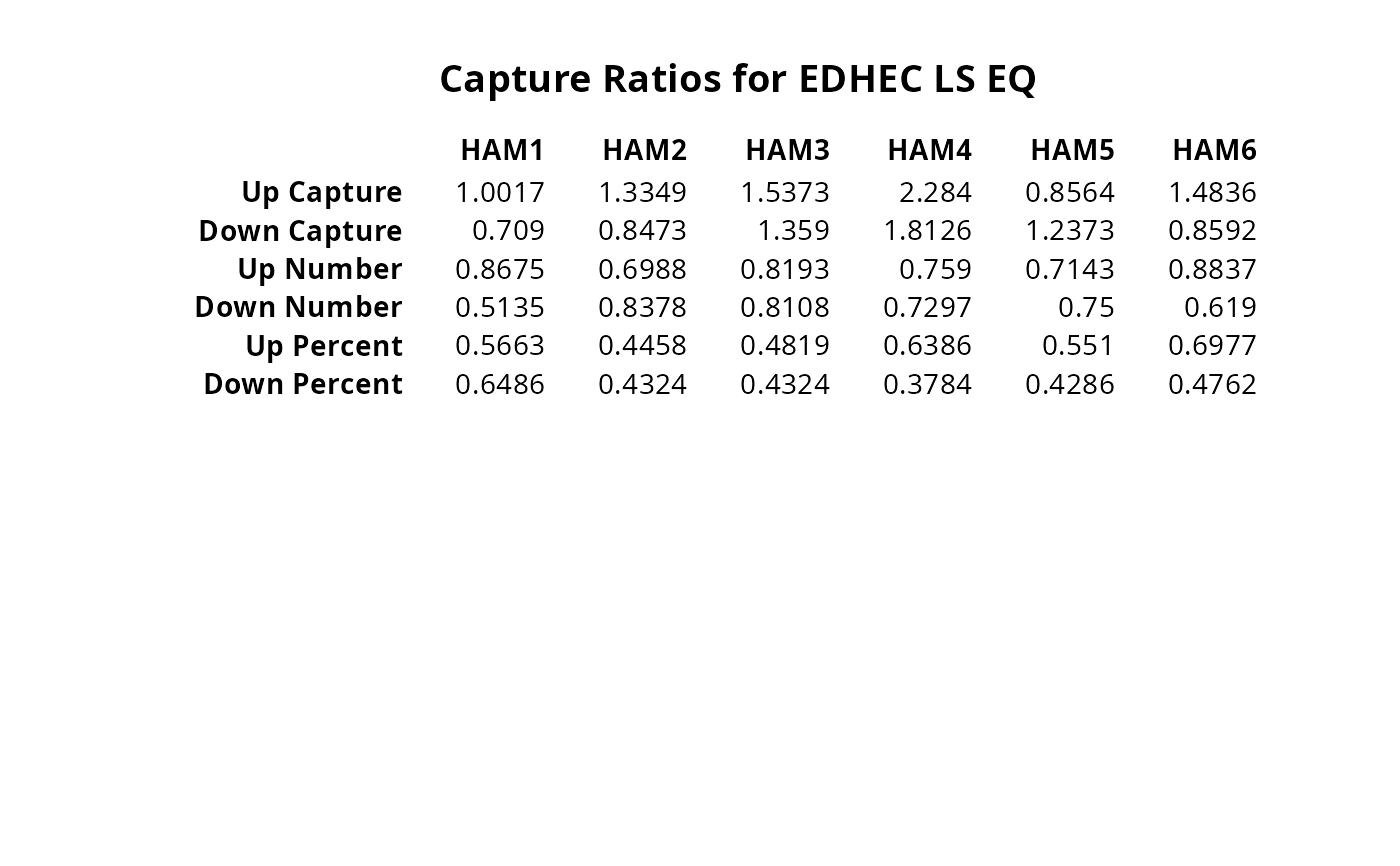
Calculate and display a table of capture ratio and related statistics
Source:R/table.CaptureRatios.R, R/table.UpDownRatios.R
table.CaptureRatios.RdCreates a table of capture ratios and similar metrics for a set of returns against a benchmark.
Usage
table.CaptureRatios(Ra, Rb, digits = 4, geometric = TRUE)

table.UpDownRatios(Ra, Rb, digits = 4, geometric = TRUE)
Arguments
- Ra
a vector of returns to test, e.g., the asset to be examined
- Rb
a matrix, data.frame, or timeSeries of benchmark(s) to test the asset against.
- digits
number of digits to round results to for presentation
- geometric
utilize geometric chaining (TRUE) or simple/arithmetic chaining (FALSE) to aggregate returns, default TRUE
Details
This table will show statistics pertaining to an asset against a set of
benchmarks, or statistics for a set of assets against a benchmark.
table.CaptureRatios shows only the capture ratio;
table.UpDownRatios shows three: the capture ratio, the number ratio,
and the percentage ratio.
Examples
data(managers)
table.CaptureRatios(managers[, 1:6], managers[, 7, drop = FALSE])
#>      Up Capture Down Capture
#> HAM1     1.0017       0.7090
#> HAM2     1.3349       0.8473
#> HAM3     1.5373       1.3590
#> HAM4     2.2840       1.8126
#> HAM5     0.8564       1.2373
#> HAM6     1.4836       0.8592
table.UpDownRatios(managers[, 1:6], managers[, 7, drop = FALSE])
#>                     Up Capture Down Capture Up Number Down Number Up Percent
#> HAM1 to EDHEC LS EQ     1.0017       0.7090    0.8675      0.5135     0.5663
#> HAM2 to EDHEC LS EQ     1.3349       0.8473    0.6988      0.8378     0.4458
#> HAM3 to EDHEC LS EQ     1.5373       1.3590    0.8193      0.8108     0.4819
#> HAM4 to EDHEC LS EQ     2.2840       1.8126    0.7590      0.7297     0.6386
#> HAM5 to EDHEC LS EQ     0.8564       1.2373    0.7143      0.7500     0.5510
#> HAM6 to EDHEC LS EQ     1.4836       0.8592    0.8837      0.6190     0.6977
#>                     Down Percent
#> HAM1 to EDHEC LS EQ       0.6486
#> HAM2 to EDHEC LS EQ       0.4324
#> HAM3 to EDHEC LS EQ       0.4324
#> HAM4 to EDHEC LS EQ       0.3784
#> HAM5 to EDHEC LS EQ       0.4286
#> HAM6 to EDHEC LS EQ       0.4762

result <- t(table.UpDownRatios(managers[, 1:6], managers[, 7, drop = FALSE]))
colnames(result) <- colnames(managers[, 1:6])
textplot(result,
  rmar = 0.8, cmar = 1.5, max.cex = .9,
  halign = "center", valign = "top", row.valign = "center",
  wrap.rownames = 15, wrap.colnames = 10, mar = c(0, 0, 3, 0) + 0.1
)

title(main = "Capture Ratios for EDHEC LS EQ")