These versions of the quantile functions take a vector of central probabilities as its first argument.
Arguments
- p
vector of probabilities.
- mean
vector of means.
- sd
vector of standard deviations.
- log.p
logical. If TRUE, uses the log of probabilities.
- side
One of "upper", "lower", or "both" indicating whether a vector of upper or lower quantiles or a matrix of both should be returned.
- df
degrees of freedom (\(> 0\), maybe non-integer).
df
      = Inf
is allowed.- ncp
non-centrality parameter \(\delta\); currently except for
rt(), accurate only forabs(ncp) <= 37.62. If omitted, use the central \(t\) distribution.
Examples
qnorm(.975)
#> [1] 1.959964
cnorm(.95)
#> lower upper
#> [1,] -1.959964 1.959964
xcnorm(.95)
#>
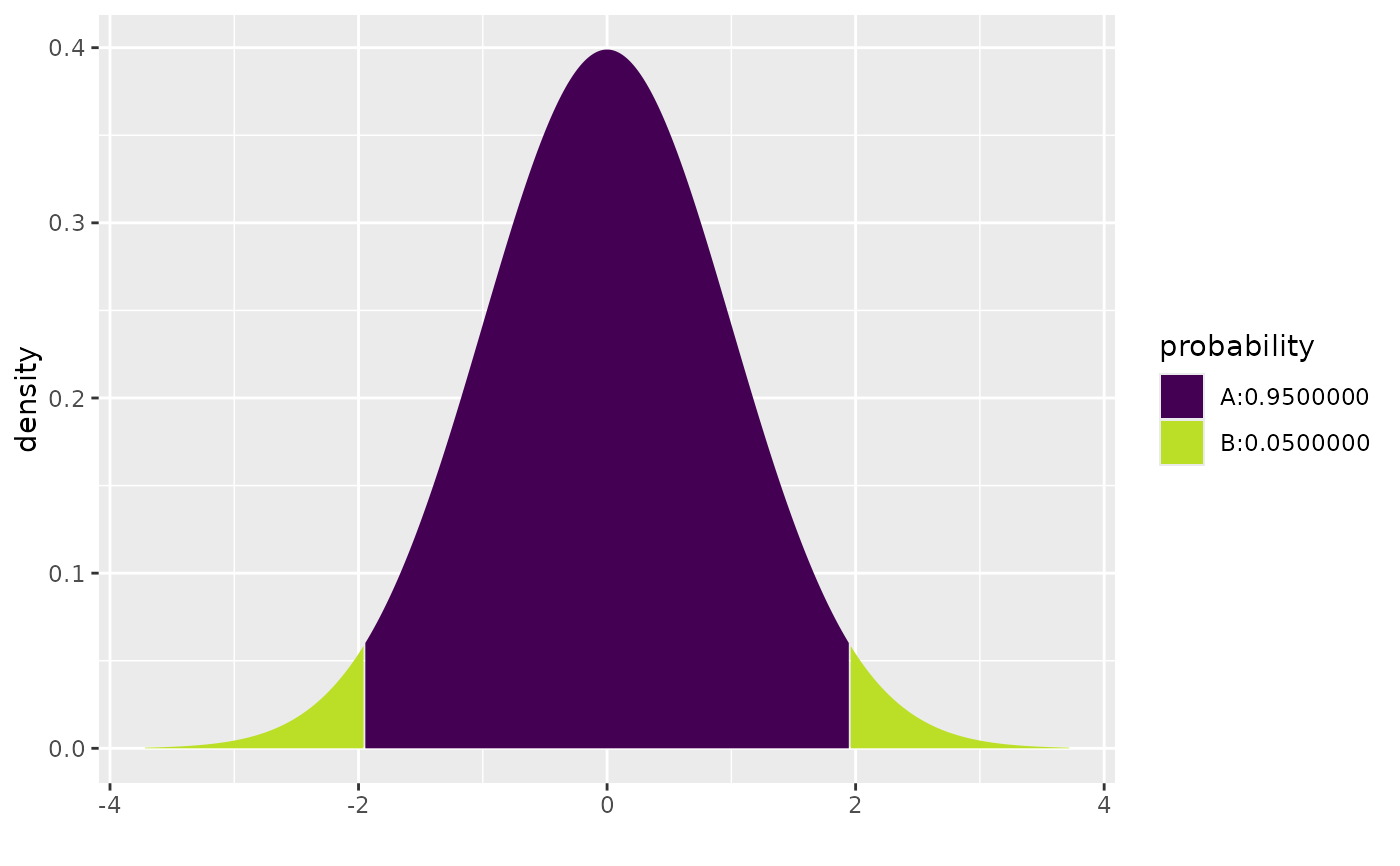
#> If X ~ N(0, 1), then
#> P(X <= -1.959964) = 0.025 P(X <= 1.959964) = 0.975
#> P(X > -1.959964) = 0.975 P(X > 1.959964) = 0.025
#>
 #> [1] -1.959964 1.959964
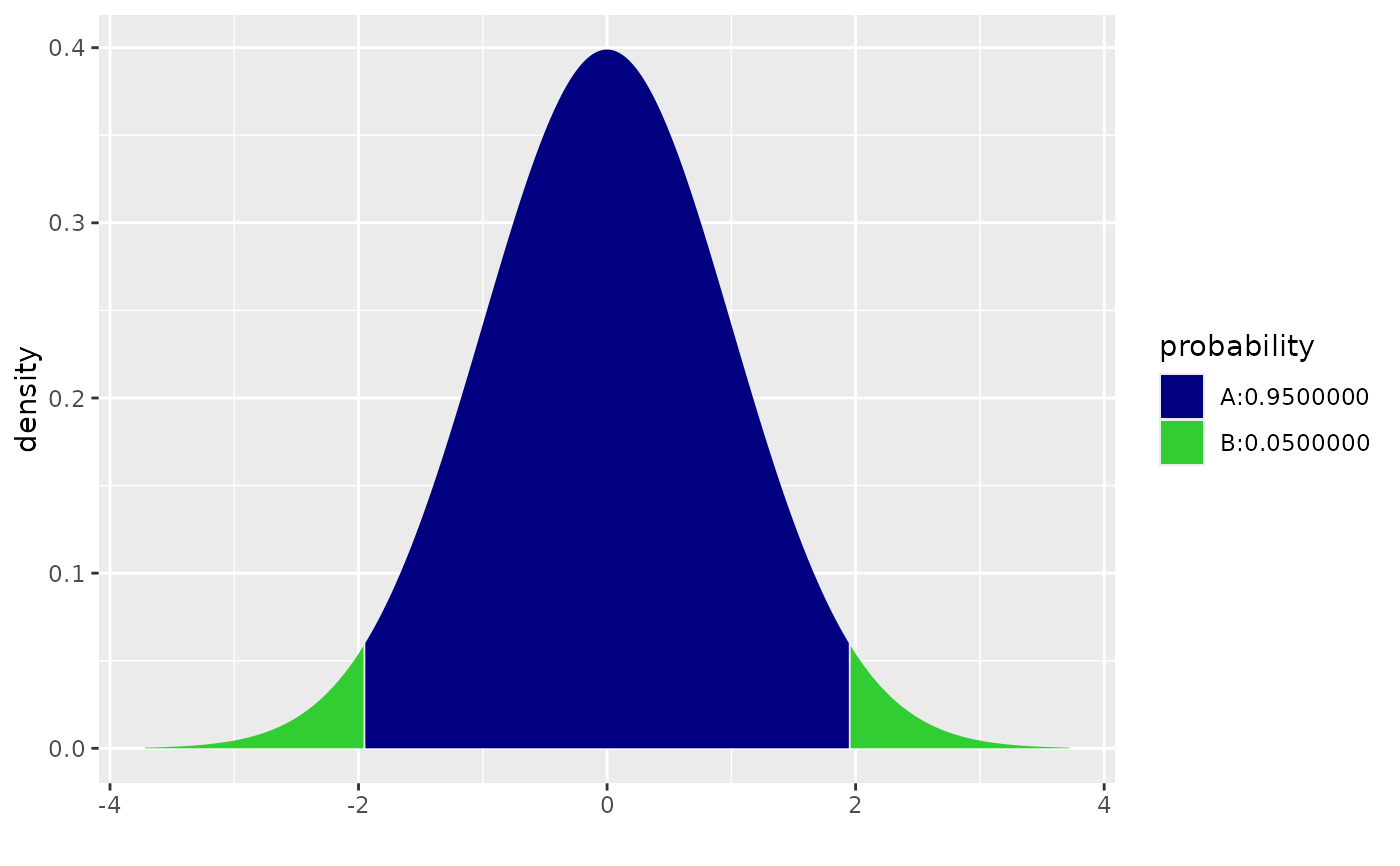
xcnorm(.95, verbose = FALSE, return = "plot") |>
gf_refine(
scale_fill_manual( values = c("navy", "limegreen")),
scale_color_manual(values = c("black", "black")))
#> Scale for fill is already present.
#> Adding another scale for fill, which will replace the existing scale.
#> Scale for colour is already present.
#> Adding another scale for colour, which will replace the existing scale.
#> [1] -1.959964 1.959964
xcnorm(.95, verbose = FALSE, return = "plot") |>
gf_refine(
scale_fill_manual( values = c("navy", "limegreen")),
scale_color_manual(values = c("black", "black")))
#> Scale for fill is already present.
#> Adding another scale for fill, which will replace the existing scale.
#> Scale for colour is already present.
#> Adding another scale for colour, which will replace the existing scale.
 cnorm(.95, mean = 100, sd = 10)
#> lower upper
#> [1,] 80.40036 119.5996
xcnorm(.95, mean = 100, sd = 10)
#>
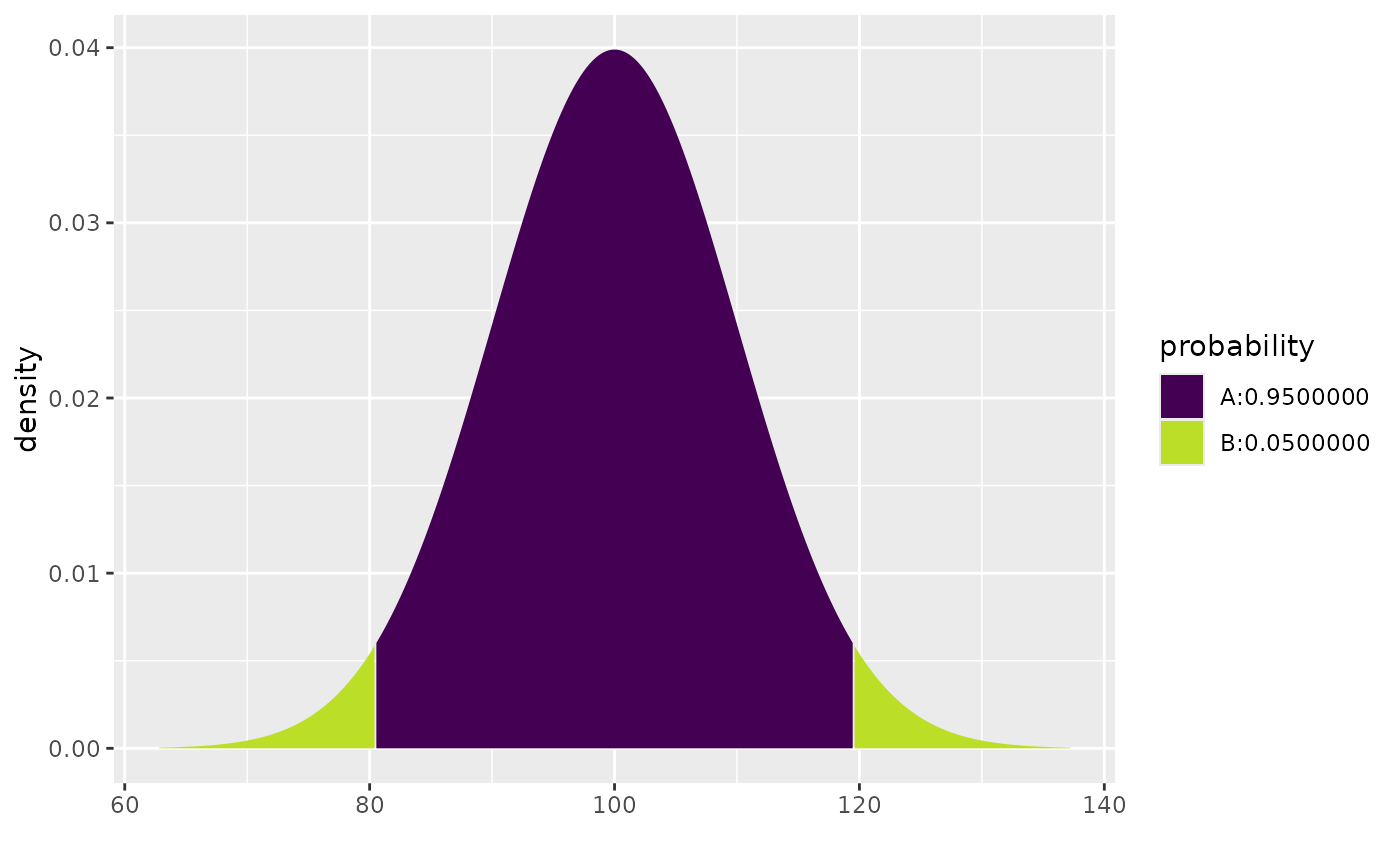
#> If X ~ N(100, 10), then
#> P(X <= 80.40036) = 0.025 P(X <= 119.59964) = 0.975
#> P(X > 80.40036) = 0.975 P(X > 119.59964) = 0.025
#>
cnorm(.95, mean = 100, sd = 10)
#> lower upper
#> [1,] 80.40036 119.5996
xcnorm(.95, mean = 100, sd = 10)
#>
#> If X ~ N(100, 10), then
#> P(X <= 80.40036) = 0.025 P(X <= 119.59964) = 0.975
#> P(X > 80.40036) = 0.975 P(X > 119.59964) = 0.025
#>
 #> [1] 80.40036 119.59964