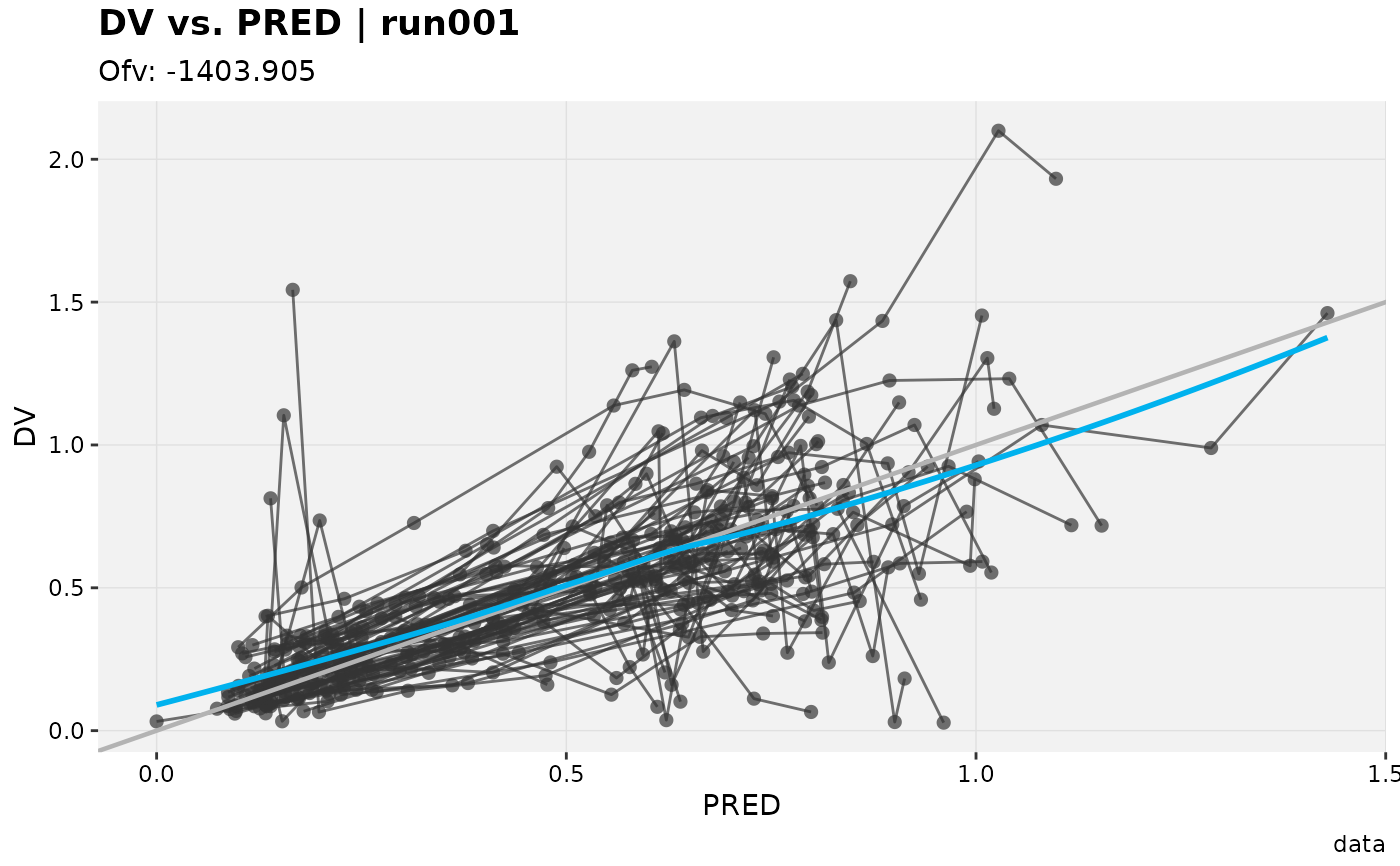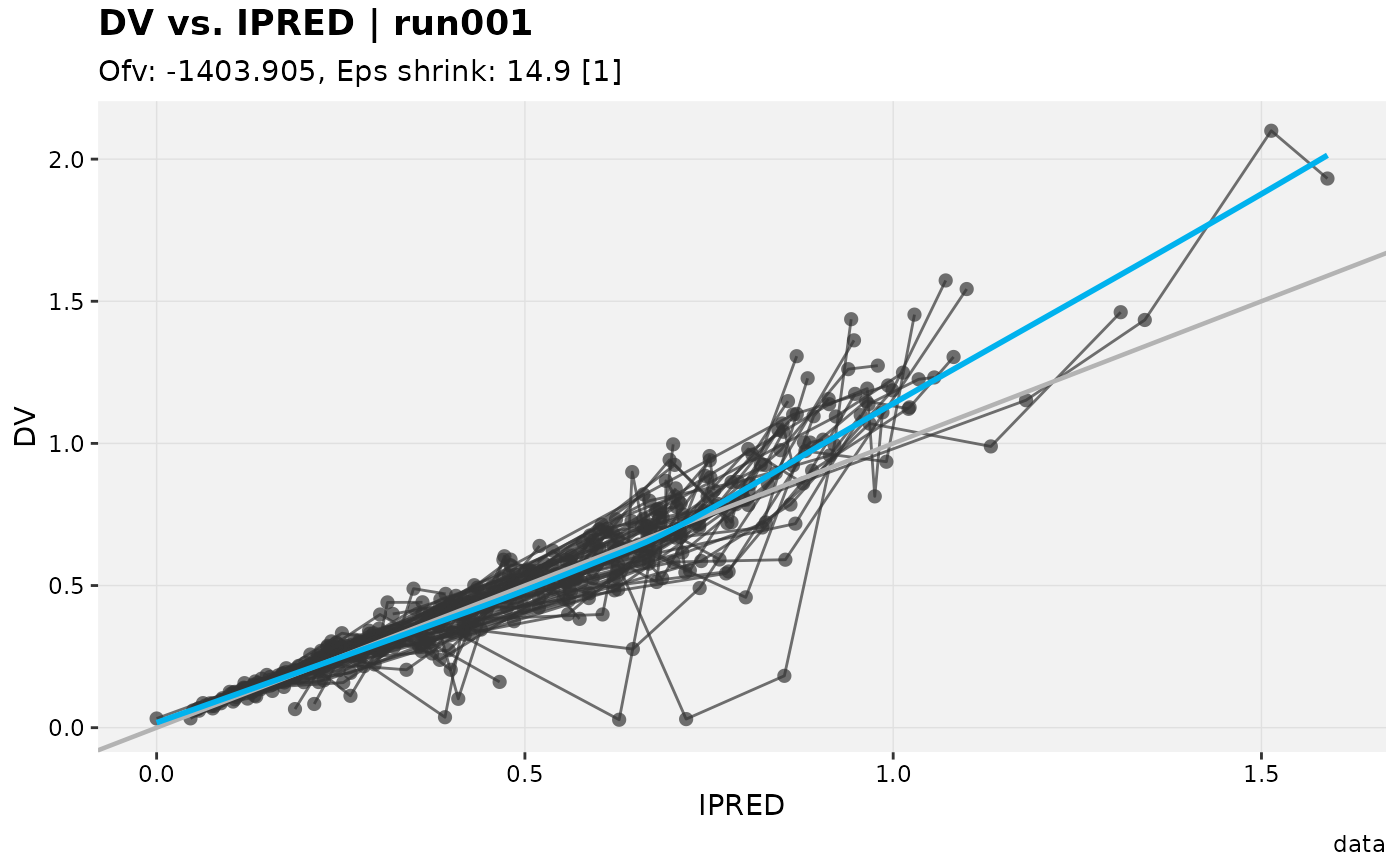
Plot of observations (DV) vs population predictions (PRED), individual predictions (IPRED) or conditional population predictions (CPRED).
Usage
dv_vs_ipred(
  xpdb,
  mapping = NULL,
  group = "ID",
  type = "pls",
  title = "@y vs. @x | @run",
  subtitle = "Ofv: @ofv, Eps shrink: @epsshk",
  caption = "@dir",
  tag = NULL,
  log = NULL,
  guide = TRUE,
  facets,
  .problem,
  quiet,
  ...
)

dv_vs_pred(
  xpdb,
  mapping = NULL,
  group = "ID",
  type = "pls",
  title = "@y vs. @x | @run",
  subtitle = "Ofv: @ofv",
  caption = "@dir",
  tag = NULL,
  log = NULL,
  guide = TRUE,
  facets,
  .problem,
  quiet,
  ...
)
Arguments
- xpdb
An xpose database object.
- mapping
List of aesthetics mappings to be used for the xpose plot (e.g.
point_color).- group
Grouping variable to be used for lines.
- type
String setting the type of plot to be used. Can be points 'p', line 'l', smooth 's' and text 't' or any combination of the four.
- title
Plot title. Use
NULLto remove.- subtitle
Plot subtitle. Use
NULLto remove.- caption
Page caption. Use
NULLto remove.- tag
Plot identification tag. Use
NULLto remove.- log
String assigning logarithmic scale to axes, can be either ”, 'x', y' or 'xy'.
- guide
Enable guide display (e.g. unity line).
- facets
Either a character string to use
facet_wrap_paginateor a formula to usefacet_grid_paginate.- .problem
The $problem number to be used. By default returns the last estimation problem.
- quiet
Logical, if
FALSEmessages are printed to the console.- ...
Any additional aesthetics to be passed on
xplot_scatter.
Layers mapping
Plots can be customized by mapping arguments to specific layers. The naming convention is layer_option where layer is one of the names defined in the list below and option is any option supported by this layer e.g. point_color = 'blue', smooth_method = 'lm', etc.
point: options to
geom_pointline: options to
geom_lineguide: options to
geom_ablinesmooth: options to
geom_smoothtext: options to
geom_textxscale: options to
scale_x_continuousorscale_x_log10yscale: options to
scale_y_continuousorscale_y_log10
Faceting
Every xpose plot function has built-in faceting functionalities. Faceting arguments
are passed to the functions facet_wrap_paginate when the facets
argument is a character string (e.g. facets = c('SEX', 'MED1')) or
facet_grid_paginate when facets is a formula (e.g. facets = SEX~MED1).
All xpose plot functions accept all the arguments for the facet_wrap_paginate
and facet_grid_paginate functions e.g. dv_vs_ipred(xpdb_ex_pk,
facets = SEX~MED1, ncol = 3, nrow = 3, page = 1, margins = TRUE, labeller = 'label_both').
Faceting options can either be defined in plot functions (e.g. dv_vs_ipred(xpdb_ex_pk,
facets = 'SEX')) or assigned globally to an xpdb object via the xp_theme (e.g. xpdb
<- update_themes(xpdb_ex_pk, xp_theme = list(facets = 'SEX'))). In the latter example all plots
generate from this xpdb will automatically be stratified by `SEX`.
By default, some plot functions use a custom stratifying variable named `variable`, e.g.
eta_distrib(). When using the facets argument, `variable` needs to be added manually
e.g. facets = c('SEX', 'variable') or facets = c('SEX', 'variable'), but is optional,
when using the facets argument in xp_theme variable is automatically added whenever needed.
Template titles
Template titles can be used to create highly informative diagnostics plots.
They can be applied to any plot title, subtitle, caption and tag. Template titles
are defined via a single string containing key variables staring with a `@` (e.g. `@ofv`)
which will be replaced by their actual value when rendering the plot.
For example `'@run, @nobs observations in @nind subjects'` would become
`'run001, 1022 observations in 74 subjects'`. The available key variables
are listed under template_titles.