Template titles can be used to create highly informative diagnostics plots.
They can be applied to any plot title, subtitle, caption and the filename when saving
with the xpose_save function.
Template titles are defined via a single string containing key variables staring with a @ (e.g. @ofv) which will be replaced by their actual value when rendering the plot. For example '@run, @nobs observations in @nind subjects' would become 'run001, 1022 observations in 74 subjects'
Many key variables are available:
- @condn
Condition number
- @covtime
Covariance matrix runtime
- @data
Model input data used
- @descr
Model description
- @dir
Model directory
- @epsshk
Epsilon shrinkage
- @errors
Run errors (e.g termination error)
- @esampleseed
ESAMPLE seed number (used in NPDE)
- @etashk
Eta shrinkage
- @file
Model file name
- @label
Model label
- @method
Estimation method or sim
- @nesample
Number of ESAMPLE (used in NPDE)
- @nind
Number of individuals
- @nobs
Number of observations
- @nsig
Number of significant digits
- @nsim
Number of simulations
- @ofv
Objective function value
- @page and @lastpage
Are respectively the page number and the number of the last page when faceting on multiple pages
- @probn
Problem number
- @plotfun
Name of the plot function
- @ref
Reference model
- @run
Model run name
- @runtime
Estimation/Sim runtime
- @software
Software used (e.g. NONMEM)
- @simseed
Simulation seed
- @subroutine
Differential equation solver
- @timestart
Run start time
- @timestop
Run stop time
- @timeplot
Time of the plot rendering
- @term
Termination message
- @version
Software version (e.g. 7.3)
- @vpcci
VPC confidence interval
- @vpcdir
VPC data directory
- @vpclloq
VPC lower limit of quantification
- @vpcnsim
Number of simulations for VPC
- @vpcpi
VPC prediction interval
- @vpculoq
VPC upper limit of quantification
- @warnings
Run warnings (e.g. boundary)
- @x @y etc.
Name of any ggplot2 variable used for mapping in an
aes()type function
Examples
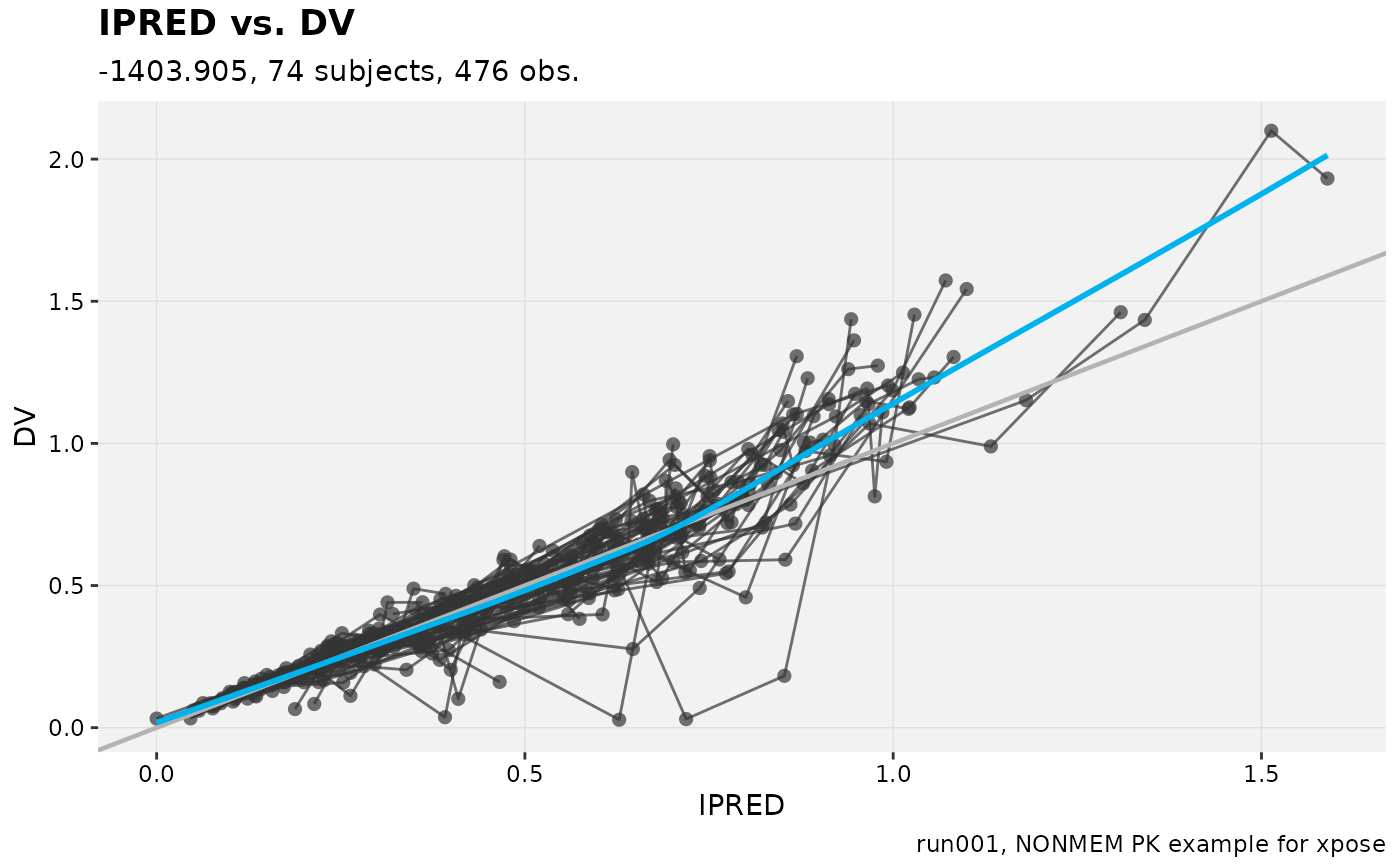
# Defined when creating a plot
dv_vs_ipred(xpdb_ex_pk,
title = '@x vs. @y',
subtitle = '@ofv, @nind subjects, @nobs obs.',
caption = '@run, @descr')
#> Using data from $prob no.1
#> Filtering data by EVID == 0
#> `geom_smooth()` using formula = 'y ~ x'
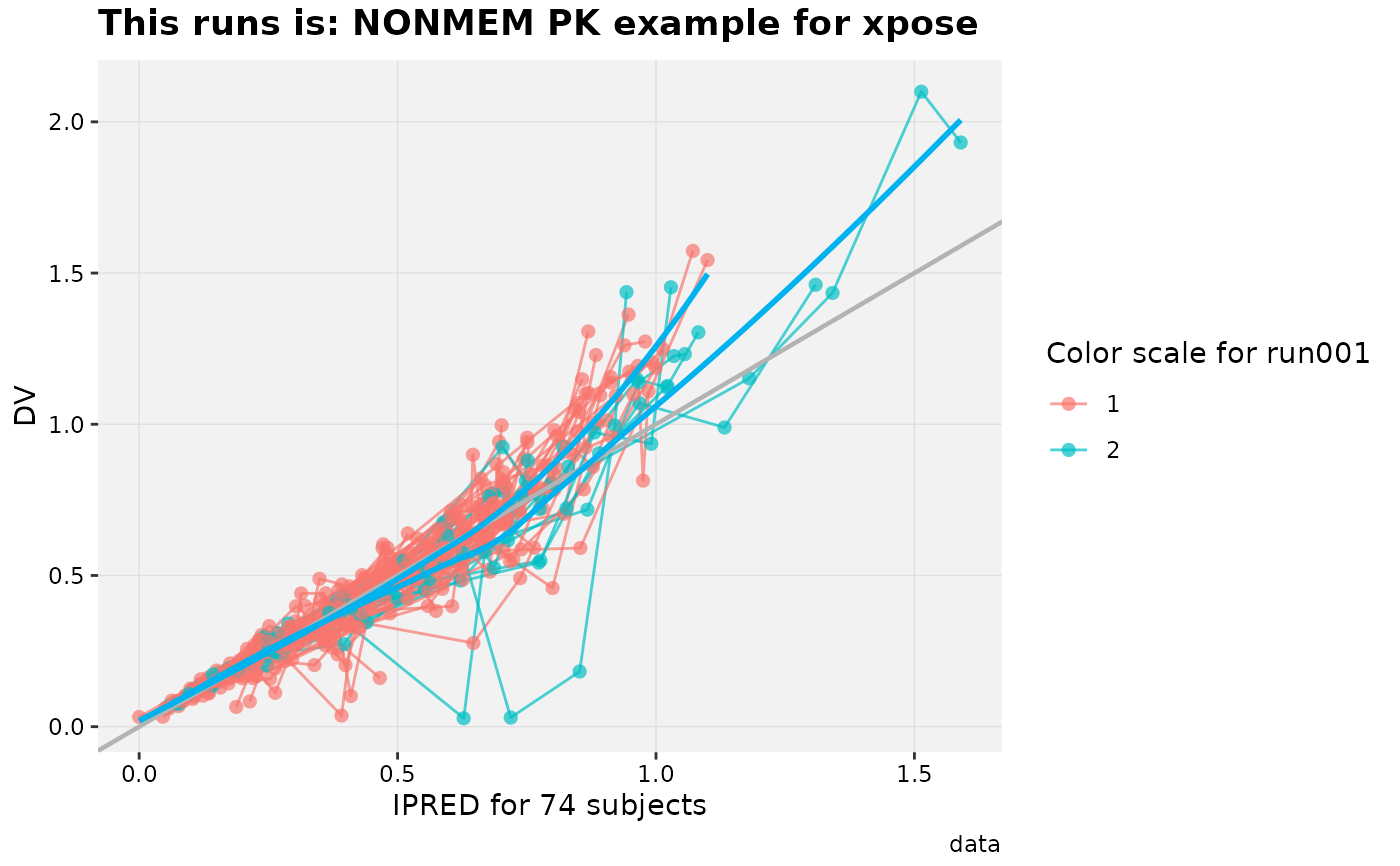
 # Any label can be modified later on
dv_vs_ipred(xpdb_ex_pk, aes(point_color = SEX,
line_color = SEX)) +
labs(title = 'This runs is: @descr',
color = 'Color scale for @run',
x = 'IPRED for @nind subjects',
subtitle = NULL)
#> Using data from $prob no.1
#> Filtering data by EVID == 0
#> `geom_smooth()` using formula = 'y ~ x'
# Any label can be modified later on
dv_vs_ipred(xpdb_ex_pk, aes(point_color = SEX,
line_color = SEX)) +
labs(title = 'This runs is: @descr',
color = 'Color scale for @run',
x = 'IPRED for @nind subjects',
subtitle = NULL)
#> Using data from $prob no.1
#> Filtering data by EVID == 0
#> `geom_smooth()` using formula = 'y ~ x'