DHARMa: Residual Diagnostics for Hierarchical (Multi-Level / Mixed) Regression Models
Source:R/DHARMa.R
DHARMa-package.Rd"Uses a simulation-based approach to create readily interpretable scaled (quantile) residuals for fitted generalized linear (mixed) models. Currently supported are linear and generalized linear (mixed) models from 'lme4' (classes 'lmerMod', 'glmerMod'), 'glmmTMB', 'GLMMadaptive', 'spaMM', and 'brms' (simple models); phylogenetic linear models from 'phylolm' (classes 'phylolm' and 'phyloglm'); generalized additive models ('gam' from 'mgcv'); 'glm' (including 'negbin' from 'MASS', but excluding quasi-distributions) and 'lm' model classes. Moreover, externally created simulations, e.g. posterior predictive simulations from Bayesian software such as 'JAGS', 'STAN', or 'BUGS' can be processed as well. The resulting residuals are standardized to values between 0 and 1 and can be interpreted as intuitively as residuals from a linear regression. The package also provides a number of plot and test functions for typical model misspecification problems, such as over/underdispersion, zero-inflation, and residual spatial, temporal and phylogenetic autocorrelation."
Details
To get started with the package, look at the vignette and start with simulateResiduals
Funding
Development and maintenance of the DHARMa package has been supported by the Deutsche Forschungsgemeinschaft (DFG), project number 528747641 (2024-now).
Examples
# simulating a dataset
testData = createData(sampleSize = 200, family = poisson(),
                      fixedEffects = c(1,1),
                      randomEffectVariance = 1, numGroups = 10)
# fitting glm model
fittedModel <- glm(observedResponse ~ Environment1 + Environment2,
                   family = "poisson", data = testData)

# simulating residuals
simulationOutput <- simulateResiduals(fittedModel = fittedModel)

#plotting residuals
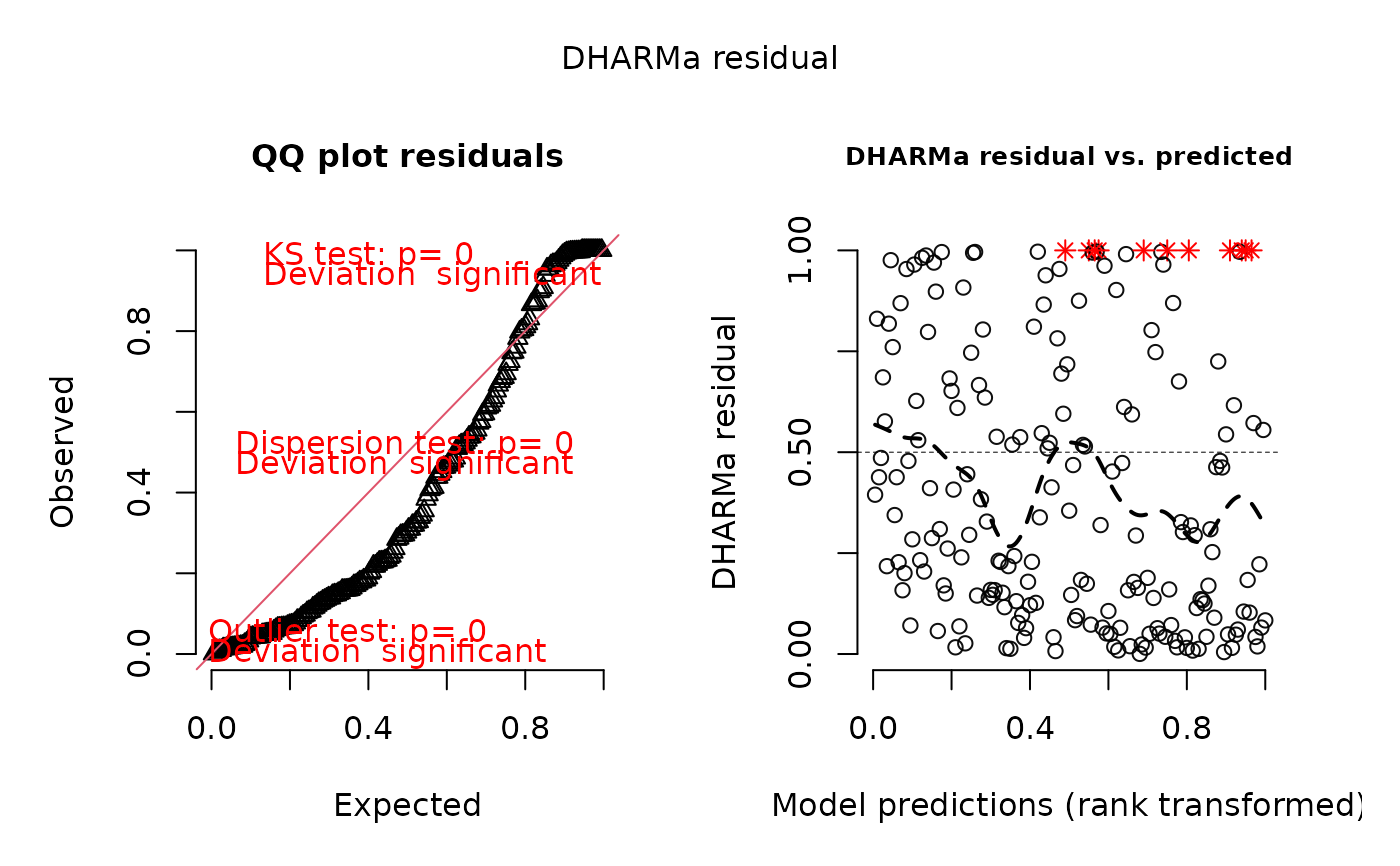
plot(simulationOutput, quantreg = FALSE)