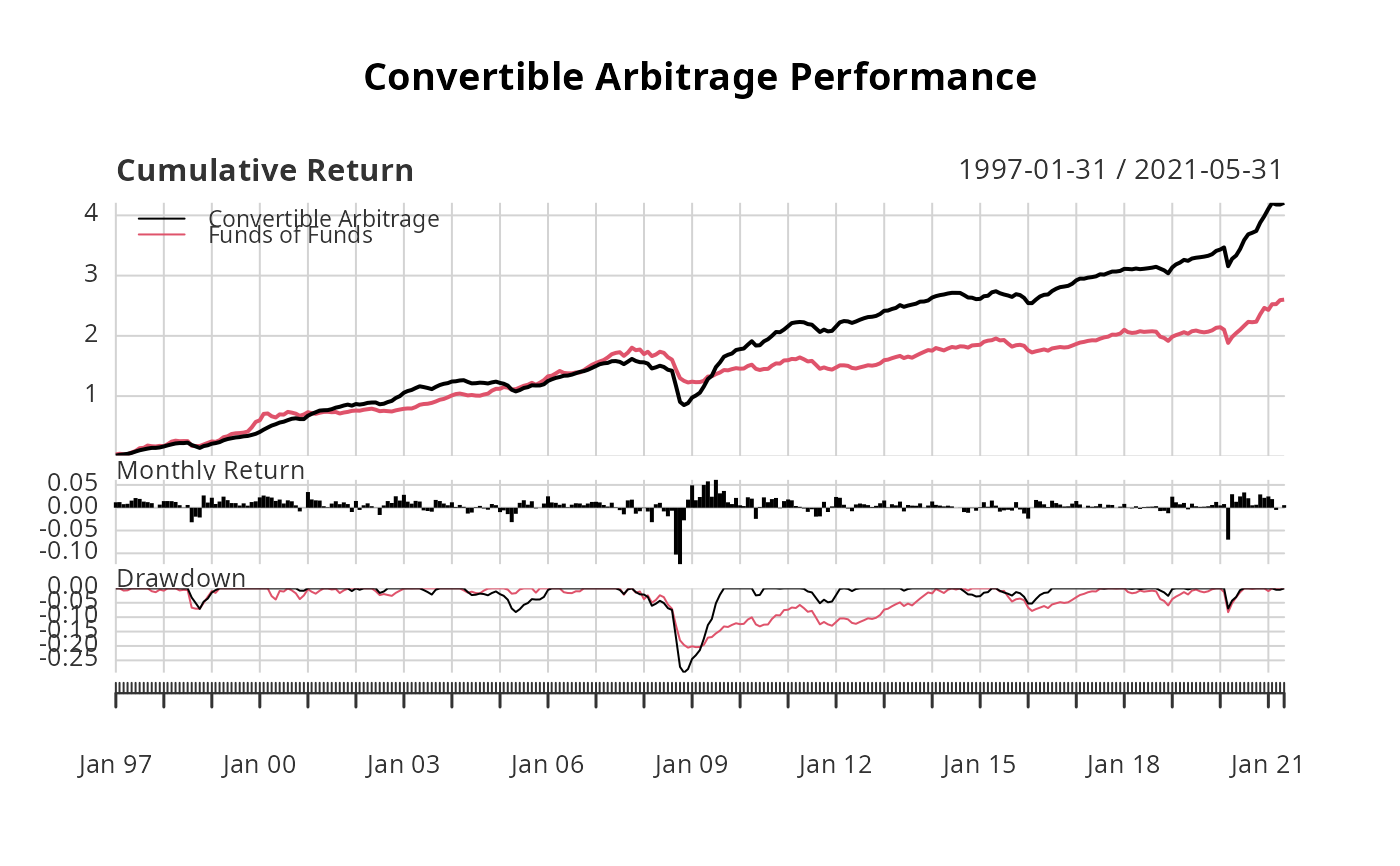
Create combined wealth index, period performance, and drawdown chart
Source:R/charts.PerformanceSummary.R
charts.PerformanceSummary.RdFor a set of returns, create a wealth index chart, bars for per-period performance, and underwater chart for drawdown.
Usage
charts.PerformanceSummary(
  R,
  Rf = 0,
  main = NULL,
  geometric = TRUE,
  methods = "none",
  width = 0,
  event.labels = NULL,
  ylog = FALSE,
  wealth.index = FALSE,
  gap = 12,
  begin = c("first", "axis"),
  legend.loc = "topleft",
  p = 0.95,
  plot.engine = "default",
  ...
)
Arguments
- R
an xts, vector, matrix, data frame, timeSeries or zoo object of asset returns
- Rf
risk free rate, in same period as your returns
- main
set the chart title, as in
plot- geometric
utilize geometric chaining (TRUE) or simple/arithmetic chaining (FALSE) to aggregate returns, default TRUE
- methods
Used to select the risk parameter of trailing
widthreturns to use in thechart.BarVaRpanel: May be any of:None - does not add a line,
ModifiedVaR - uses Cornish-Fisher modified VaR,
GaussianVaR - uses traditional Value at Risk,
HistoricalVaR - calculates historical Value at Risk,
ModifiedES - uses Cornish-Fisher modified Expected Shortfall,
GaussianES - uses traditional Expected Shortfall,
HistoricalES - calculates historical Expected Shortfall,
StdDev - per-period standard deviation
- width
number of periods to apply rolling function window over
- event.labels
TRUE/FALSE whether or not to display lines and labels for historical market shock events
- ylog
TRUE/FALSE set the y-axis to logarithmic scale, similar to
plot, default FALSE- wealth.index
if
wealth.indexisTRUE, shows the "value of $1", starting the cumulation of returns at 1 rather than zero- gap
numeric number of periods from start of series to use to train risk calculation
- begin
Align shorter series to:
first - prior value of the first column given for the reference or longer series or,
axis - the initial value (1 or zero) of the axis.
passthru to
chart.CumReturns- legend.loc
sets the legend location in the top chart. Can be set to NULL or nine locations on the chart: bottomright, bottom, bottomleft, left, topleft, top, topright, right, or center.
- p
confidence level for calculation, default p=.95
- plot.engine
choose the plot engine you wish to use" ggplot2, plotly, and default
- ...
any other passthru parameters
Note
Most inputs are the same as "plot" and are principally
included so that some sensible defaults could be set.