This function runs statistical benchmarks, including Power / Type I error simulations for an arbitrary test with a control parameter
Usage
runBenchmarks(calculateStatistics, controlValues = NULL, nRep = 10,
  alpha = 0.05, parallel = FALSE, exportGlobal = FALSE, ...)
Arguments
- calculateStatistics
the statistics to be benchmarked. Should return one value, or a vector of values. If controlValues are given, must accept a parameter control.
- controlValues
optionally, a vector with a control parameter (e.g. to vary the strength of a problem the test should be specific to). See help for an example.
- nRep
number of replicates per level of the controlValues.
- alpha
significance level.
- parallel
whether to use parallel computations. Possible values are F, T (sets the cores automatically to number of available cores -1), or an integer number for the number of cores that should be used for the cluster.
- exportGlobal
whether the global environment should be exported to the parallel nodes. This will use more memory. Set to true only if your function calculate statistics depends on other functions or global variables.
- ...
additional parameters to calculateStatistics.
Value
an object with list structure of class DHARMaBenchmark. Contains entry simulations with a matrix of simulations, and entry summaries with an list of summaries (significant (T/F), mean, p-value for KS-test uniformity). Can be plotted with plot.DHARMaBenchmark.
Note
The benchmark functions in DHARMa are intended for development purposes, and for users that want to test / confirm the properties of functions in DHARMa. If you are running an applied data analysis, they are probably of little use.
Examples
# define a function that will run a simulation and return a number of statistics, typically p-values
returnStatistics <- function(control = 0){
testData = createData(sampleSize = 20, family = poisson(), overdispersion = control,
randomEffectVariance = 0)
fittedModel <- glm(observedResponse ~ Environment1, data = testData, family = poisson())
res <- simulateResiduals(fittedModel = fittedModel, n = 250)
out <- c(testUniformity(res, plot = FALSE)$p.value, testDispersion(res, plot = FALSE)$p.value)
return(out)
}
# testing a single return
returnStatistics()
#> [1] 0.3901584 0.4800000
# running benchmark for a fixed simulation, increase nRep for sensible results
out = runBenchmarks(returnStatistics, nRep = 5)
#> Warning: NA values in the output, this might be a problem for the summaries.
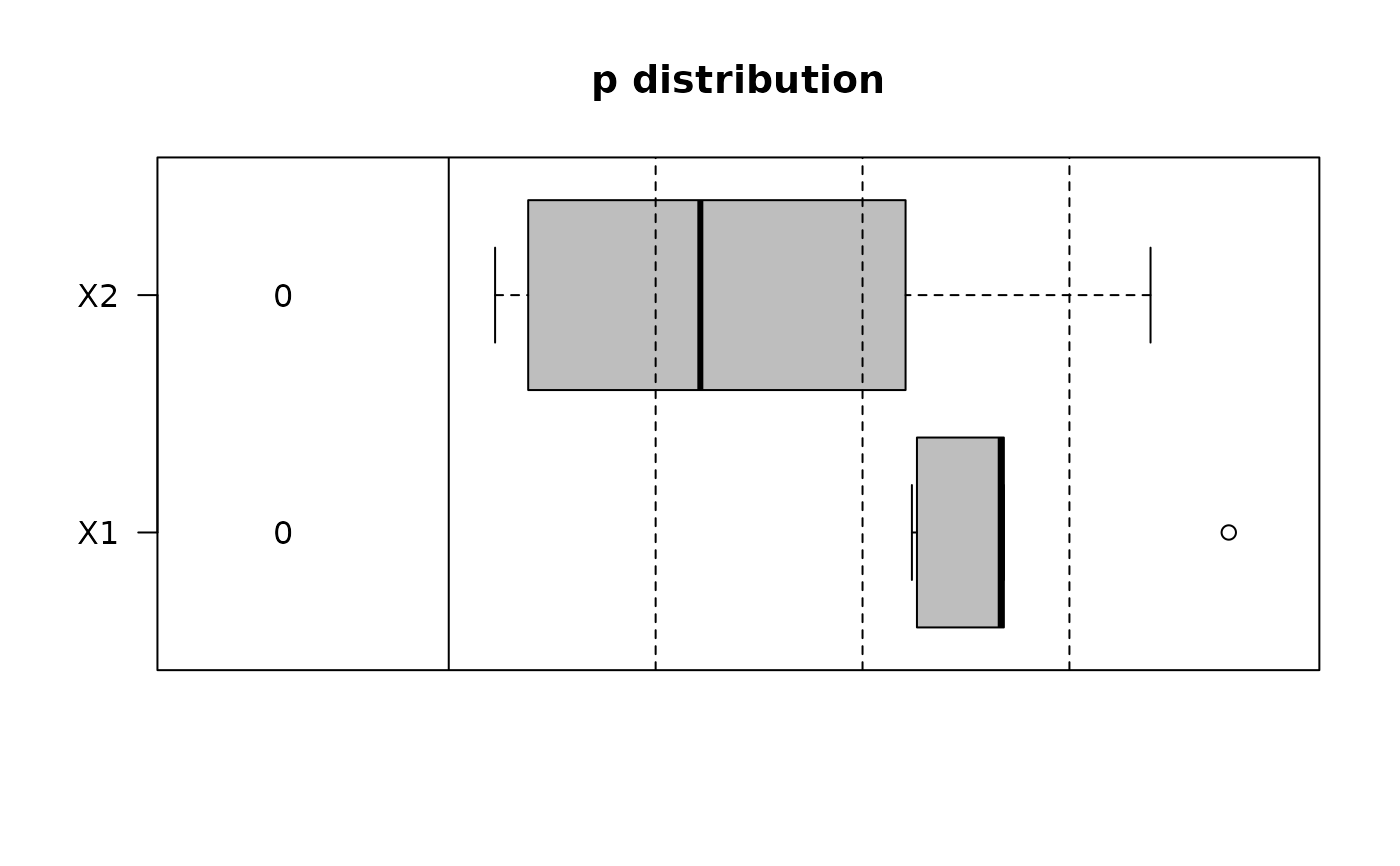
# plotting results depend on whether a vector or a single value is provided for control
plot(out)
 if (FALSE) { # \dontrun{
# running benchmark with varying control values
out = runBenchmarks(returnStatistics, controlValues = c(0,0.5,1), nRep = 100)
plot(out)
# running benchmark can be done using parallel cores
out = runBenchmarks(returnStatistics, nRep = 100, parallel = TRUE)
out = runBenchmarks(returnStatistics, controlValues = c(0,0.5,1), nRep = 10, parallel = TRUE)
# Alternative plot function using vioplot, provides nicer pictures
plot.DHARMaBenchmark <- function(x, ...){
if(length(x$controlValues)== 1){
vioplot::vioplot(x$simulations[,x$nSummaries:1], las = 2, horizontal = TRUE, side = "right",
areaEqual = FALSE,
main = "p distribution under H0",
ylim = c(-0.15,1), ...)
abline(v = 1, lty = 2)
abline(v = c(0.05, 0), lty = 2, col = "red")
text(-0.1, x$nSummaries:1, labels = x$summaries$propSignificant[-1])
}else{
res = x$summaries$propSignificant
matplot(res$controlValues, res[,-1], type = "l",
main = "Power analysis", ylab = "Power", ...)
legend("bottomright", colnames(res[,-1]),
col = 1:x$nSummaries, lty = 1:x$nSummaries, lwd = 2)
}
}
} # }
if (FALSE) { # \dontrun{
# running benchmark with varying control values
out = runBenchmarks(returnStatistics, controlValues = c(0,0.5,1), nRep = 100)
plot(out)
# running benchmark can be done using parallel cores
out = runBenchmarks(returnStatistics, nRep = 100, parallel = TRUE)
out = runBenchmarks(returnStatistics, controlValues = c(0,0.5,1), nRep = 10, parallel = TRUE)
# Alternative plot function using vioplot, provides nicer pictures
plot.DHARMaBenchmark <- function(x, ...){
if(length(x$controlValues)== 1){
vioplot::vioplot(x$simulations[,x$nSummaries:1], las = 2, horizontal = TRUE, side = "right",
areaEqual = FALSE,
main = "p distribution under H0",
ylim = c(-0.15,1), ...)
abline(v = 1, lty = 2)
abline(v = c(0.05, 0), lty = 2, col = "red")
text(-0.1, x$nSummaries:1, labels = x$summaries$propSignificant[-1])
}else{
res = x$summaries$propSignificant
matplot(res$controlValues, res[,-1], type = "l",
main = "Power analysis", ylab = "Power", ...)
legend("bottomright", colnames(res[,-1]),
col = 1:x$nSummaries, lty = 1:x$nSummaries, lwd = 2)
}
}
} # }